
2025 Portfolio Results
How the 2025 portfolio was constructed and how it fared

A year has gone by now in which I’ve been trading my portfolio and the subsequent systems that make it up, so its worth a look back to see how it has gone.
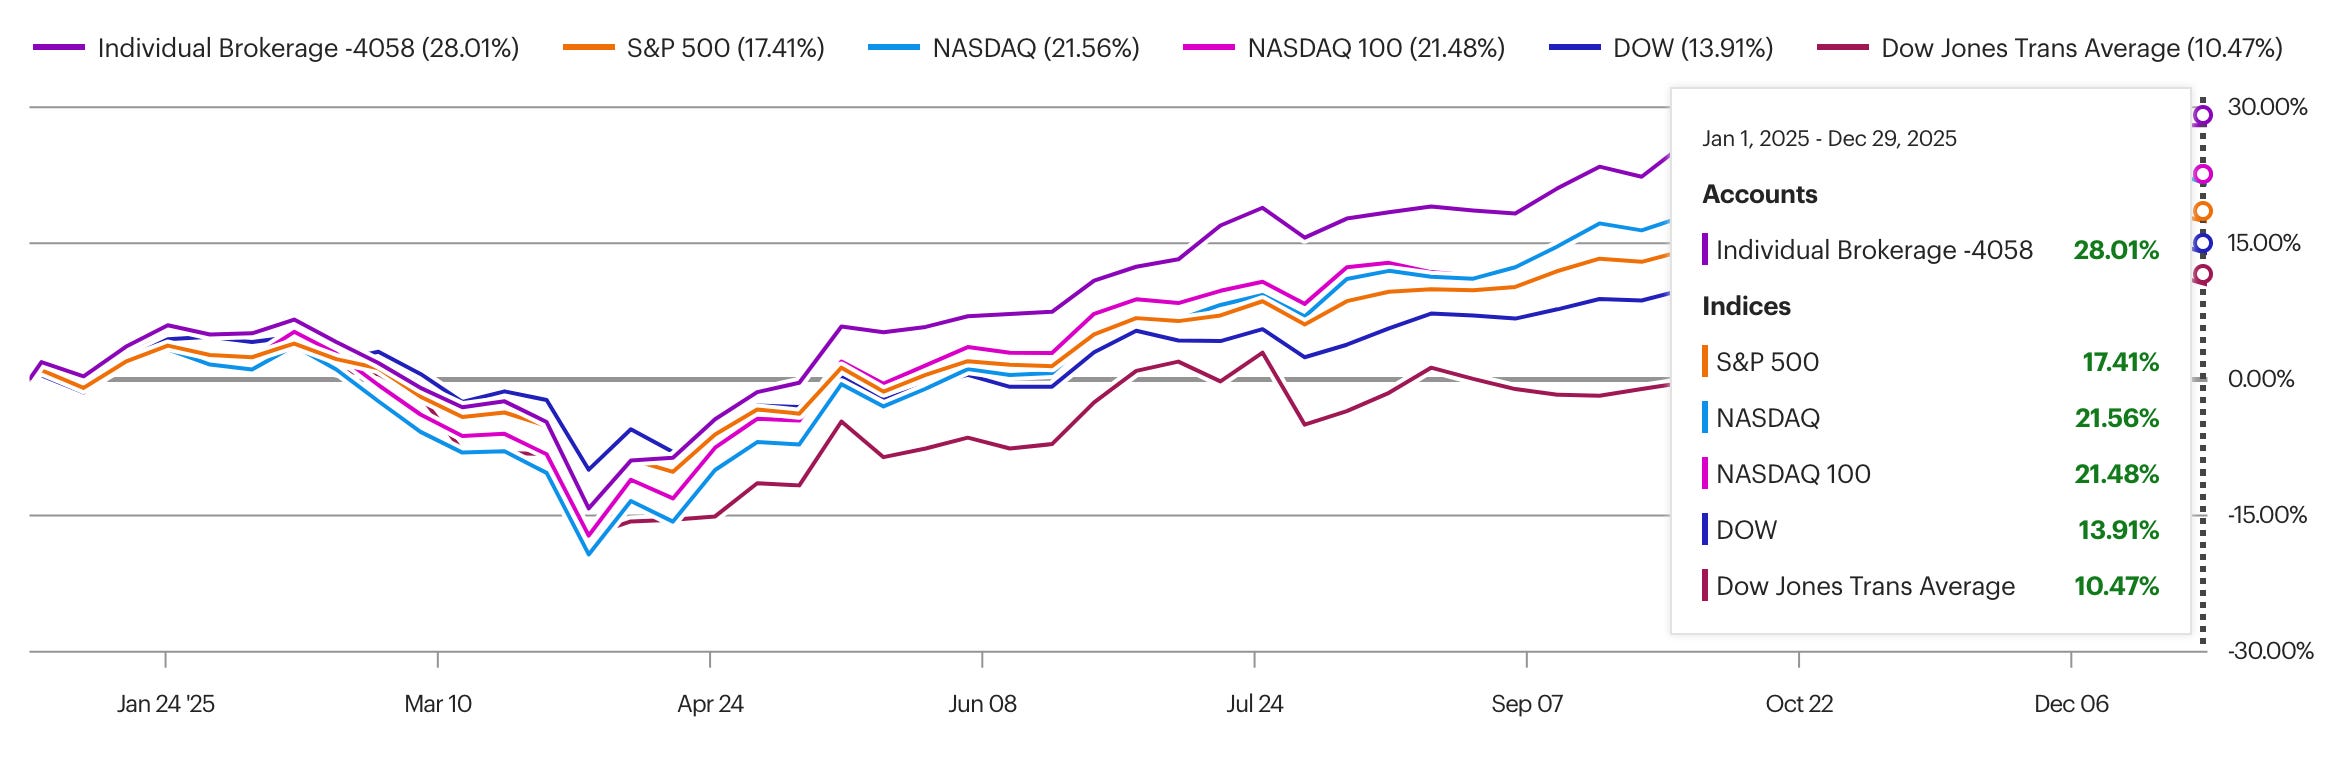
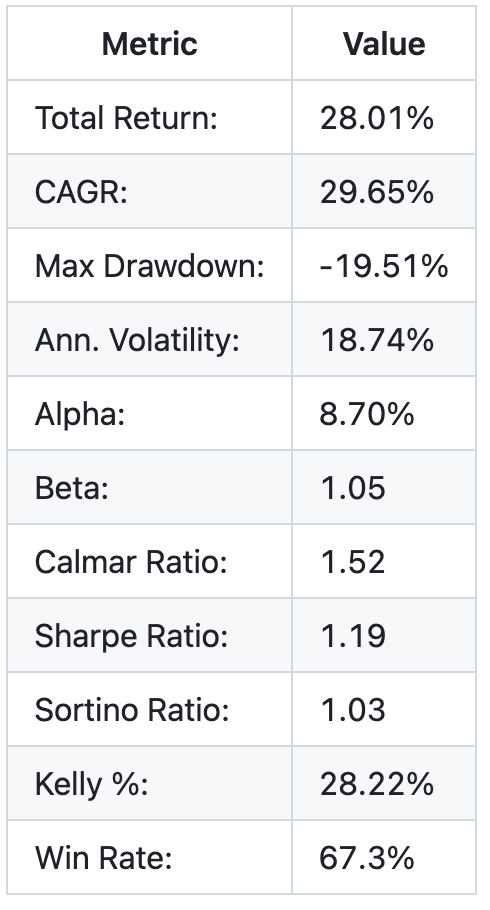
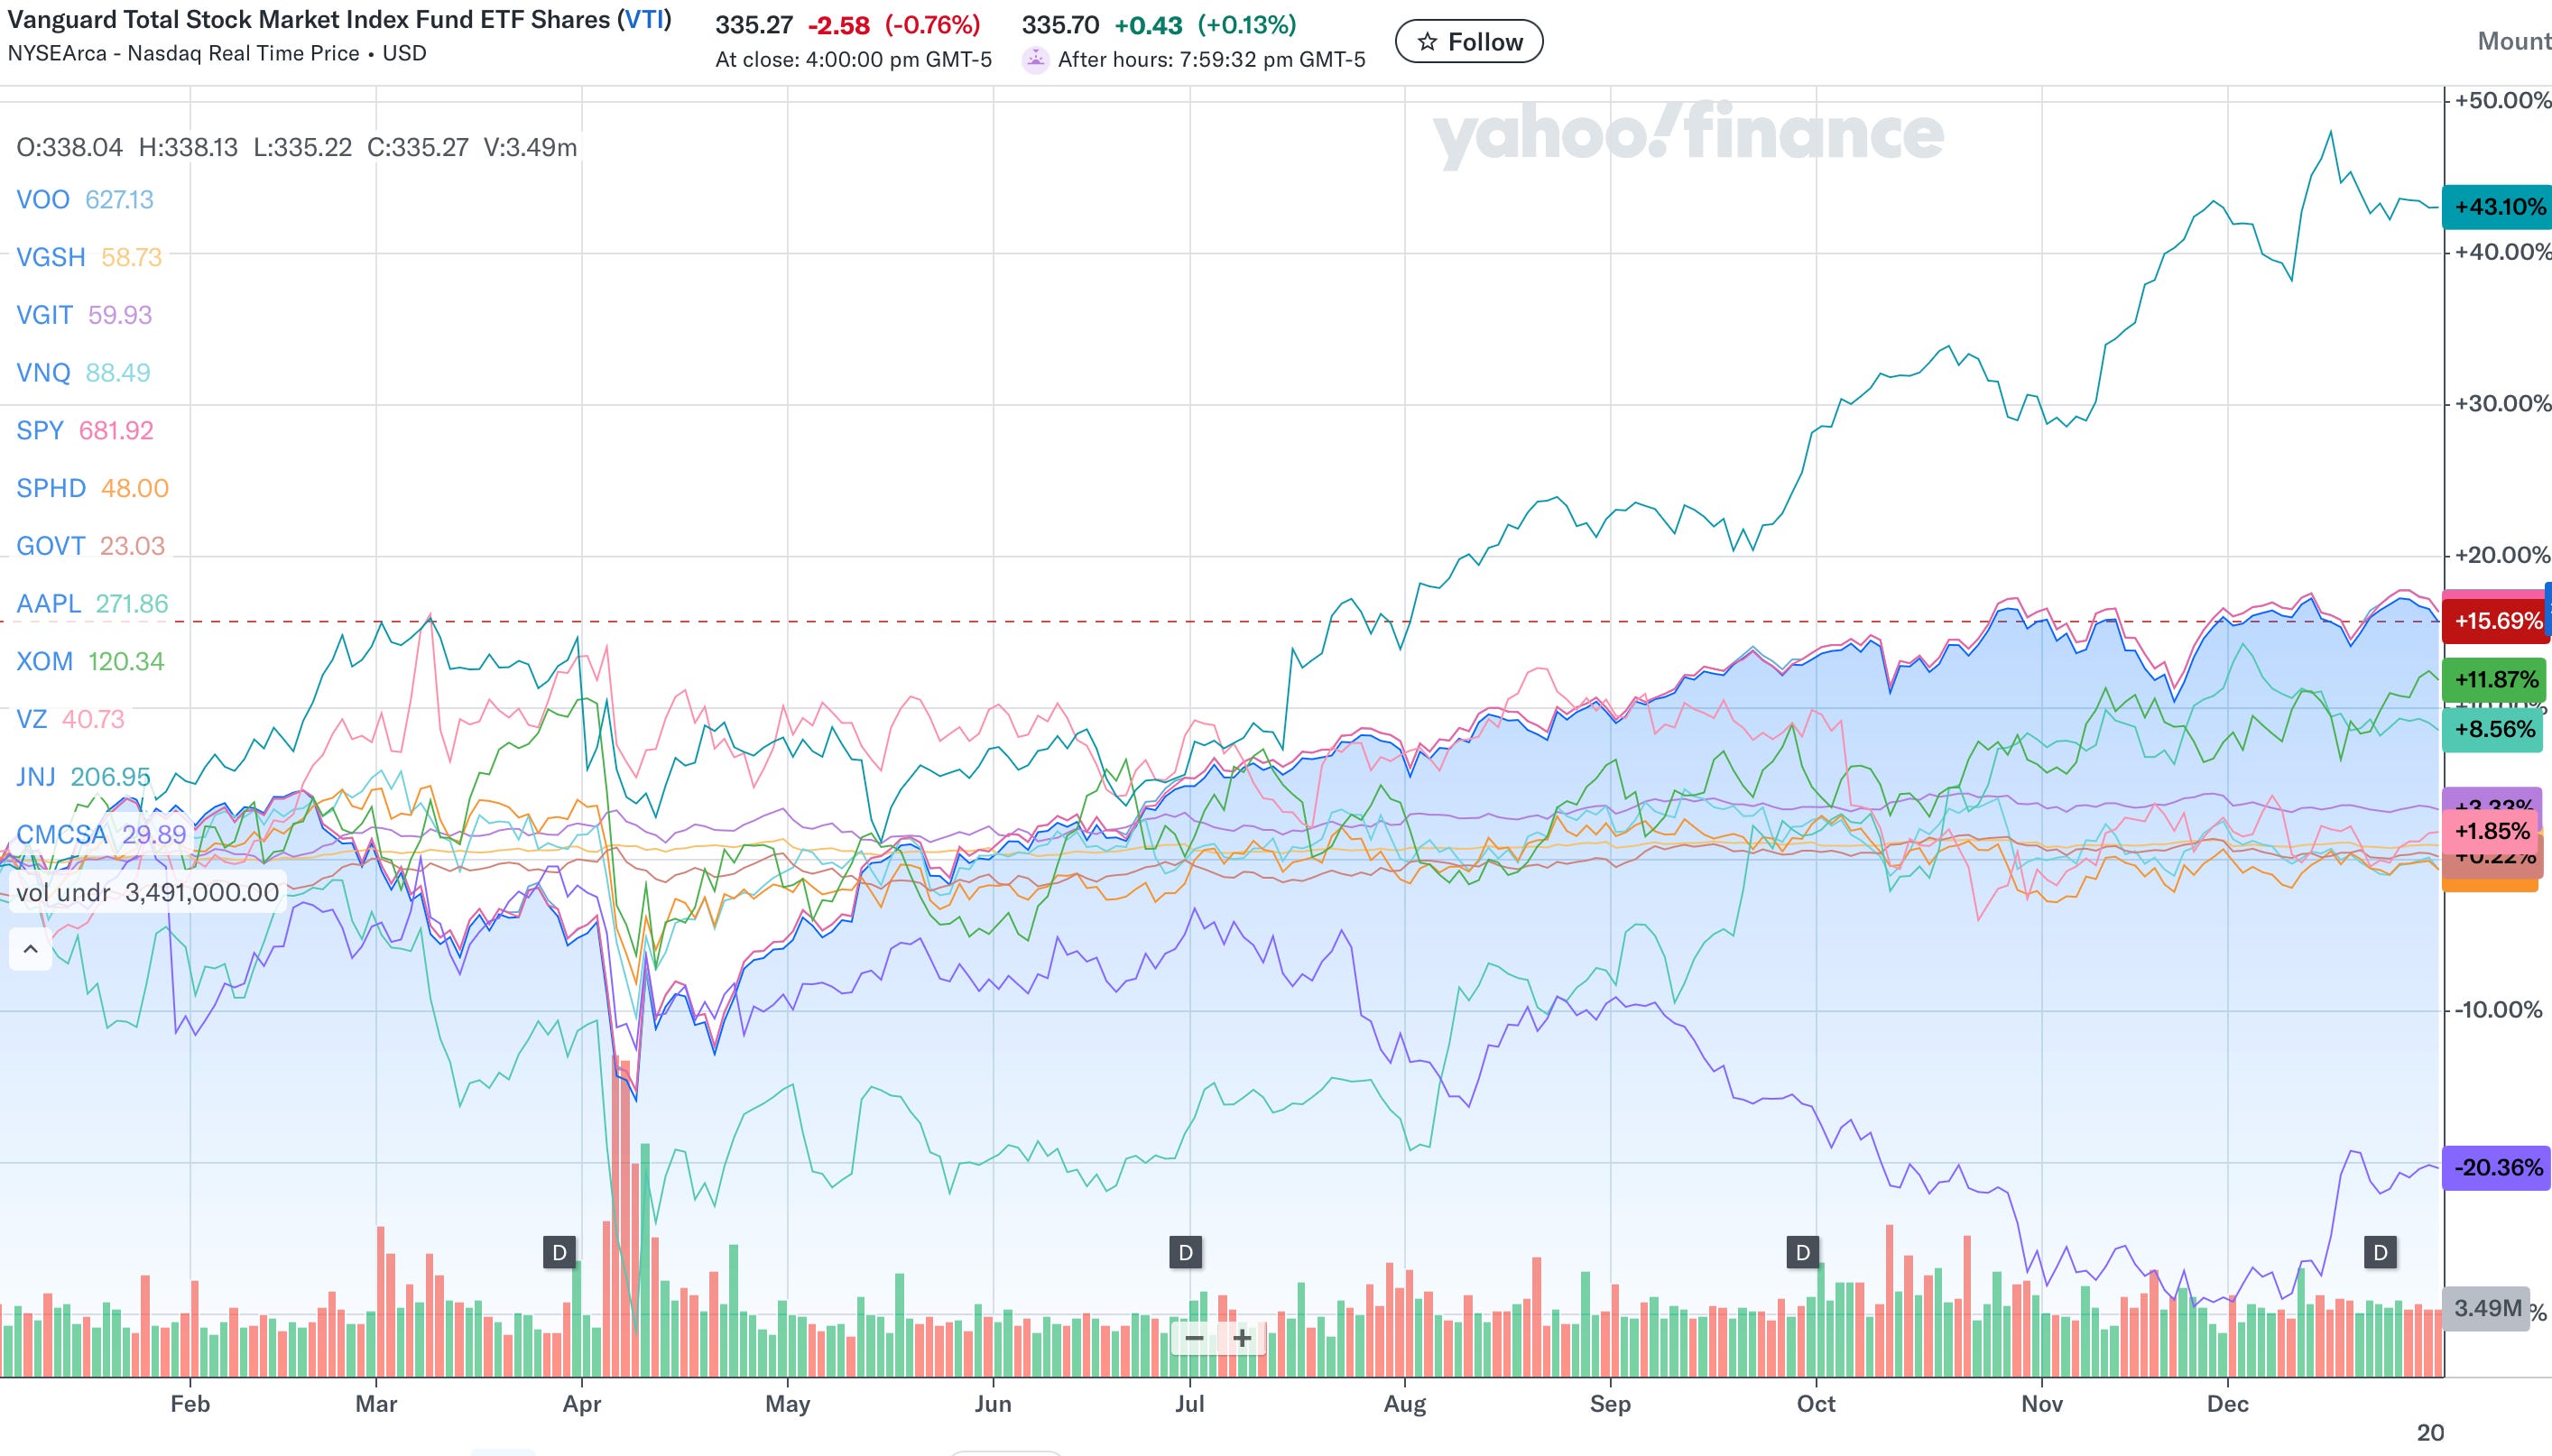
As we can see YTD performance is a solid 28.01%, beating out the S&P 500 benchmark by just over 10%. Here’s some other metrics:
Notable factors here are the big draw-down during the tariff shock earlier this year. Tariffs were an unprecedented economic move and rightfully so the markets panicked, but later picked themselves back up as the tariff frenzy began to even out, and the market began to price in TACO trades.
The good news the CAGR (29.65%), Calmar Ratio (1.52) and Sharpe Ratio (1.19) are all very healthy numbers, indicating great performance.
The areas to improve on here are the Beta (1.05) which indicates we are very correlated with the market in general, the more this number can be compressed the better, it will be hard to reduce it beyond a certain amount and maintain the same performance without switching up some of the strategies to a shorter time horizon. The Kelly % (28.22%) is also lower than I would like, mainly due again to the tariff shock, ideally this number should be above 100% so leverage can be applied to the portfolio.
The portfolio is currently structured into a risk on and risk off component, with 35% allocated to the risk off and the rest to risk on. Every quarter it is rebalanced, weights are recalculated and recommendations rerun.
Risk On
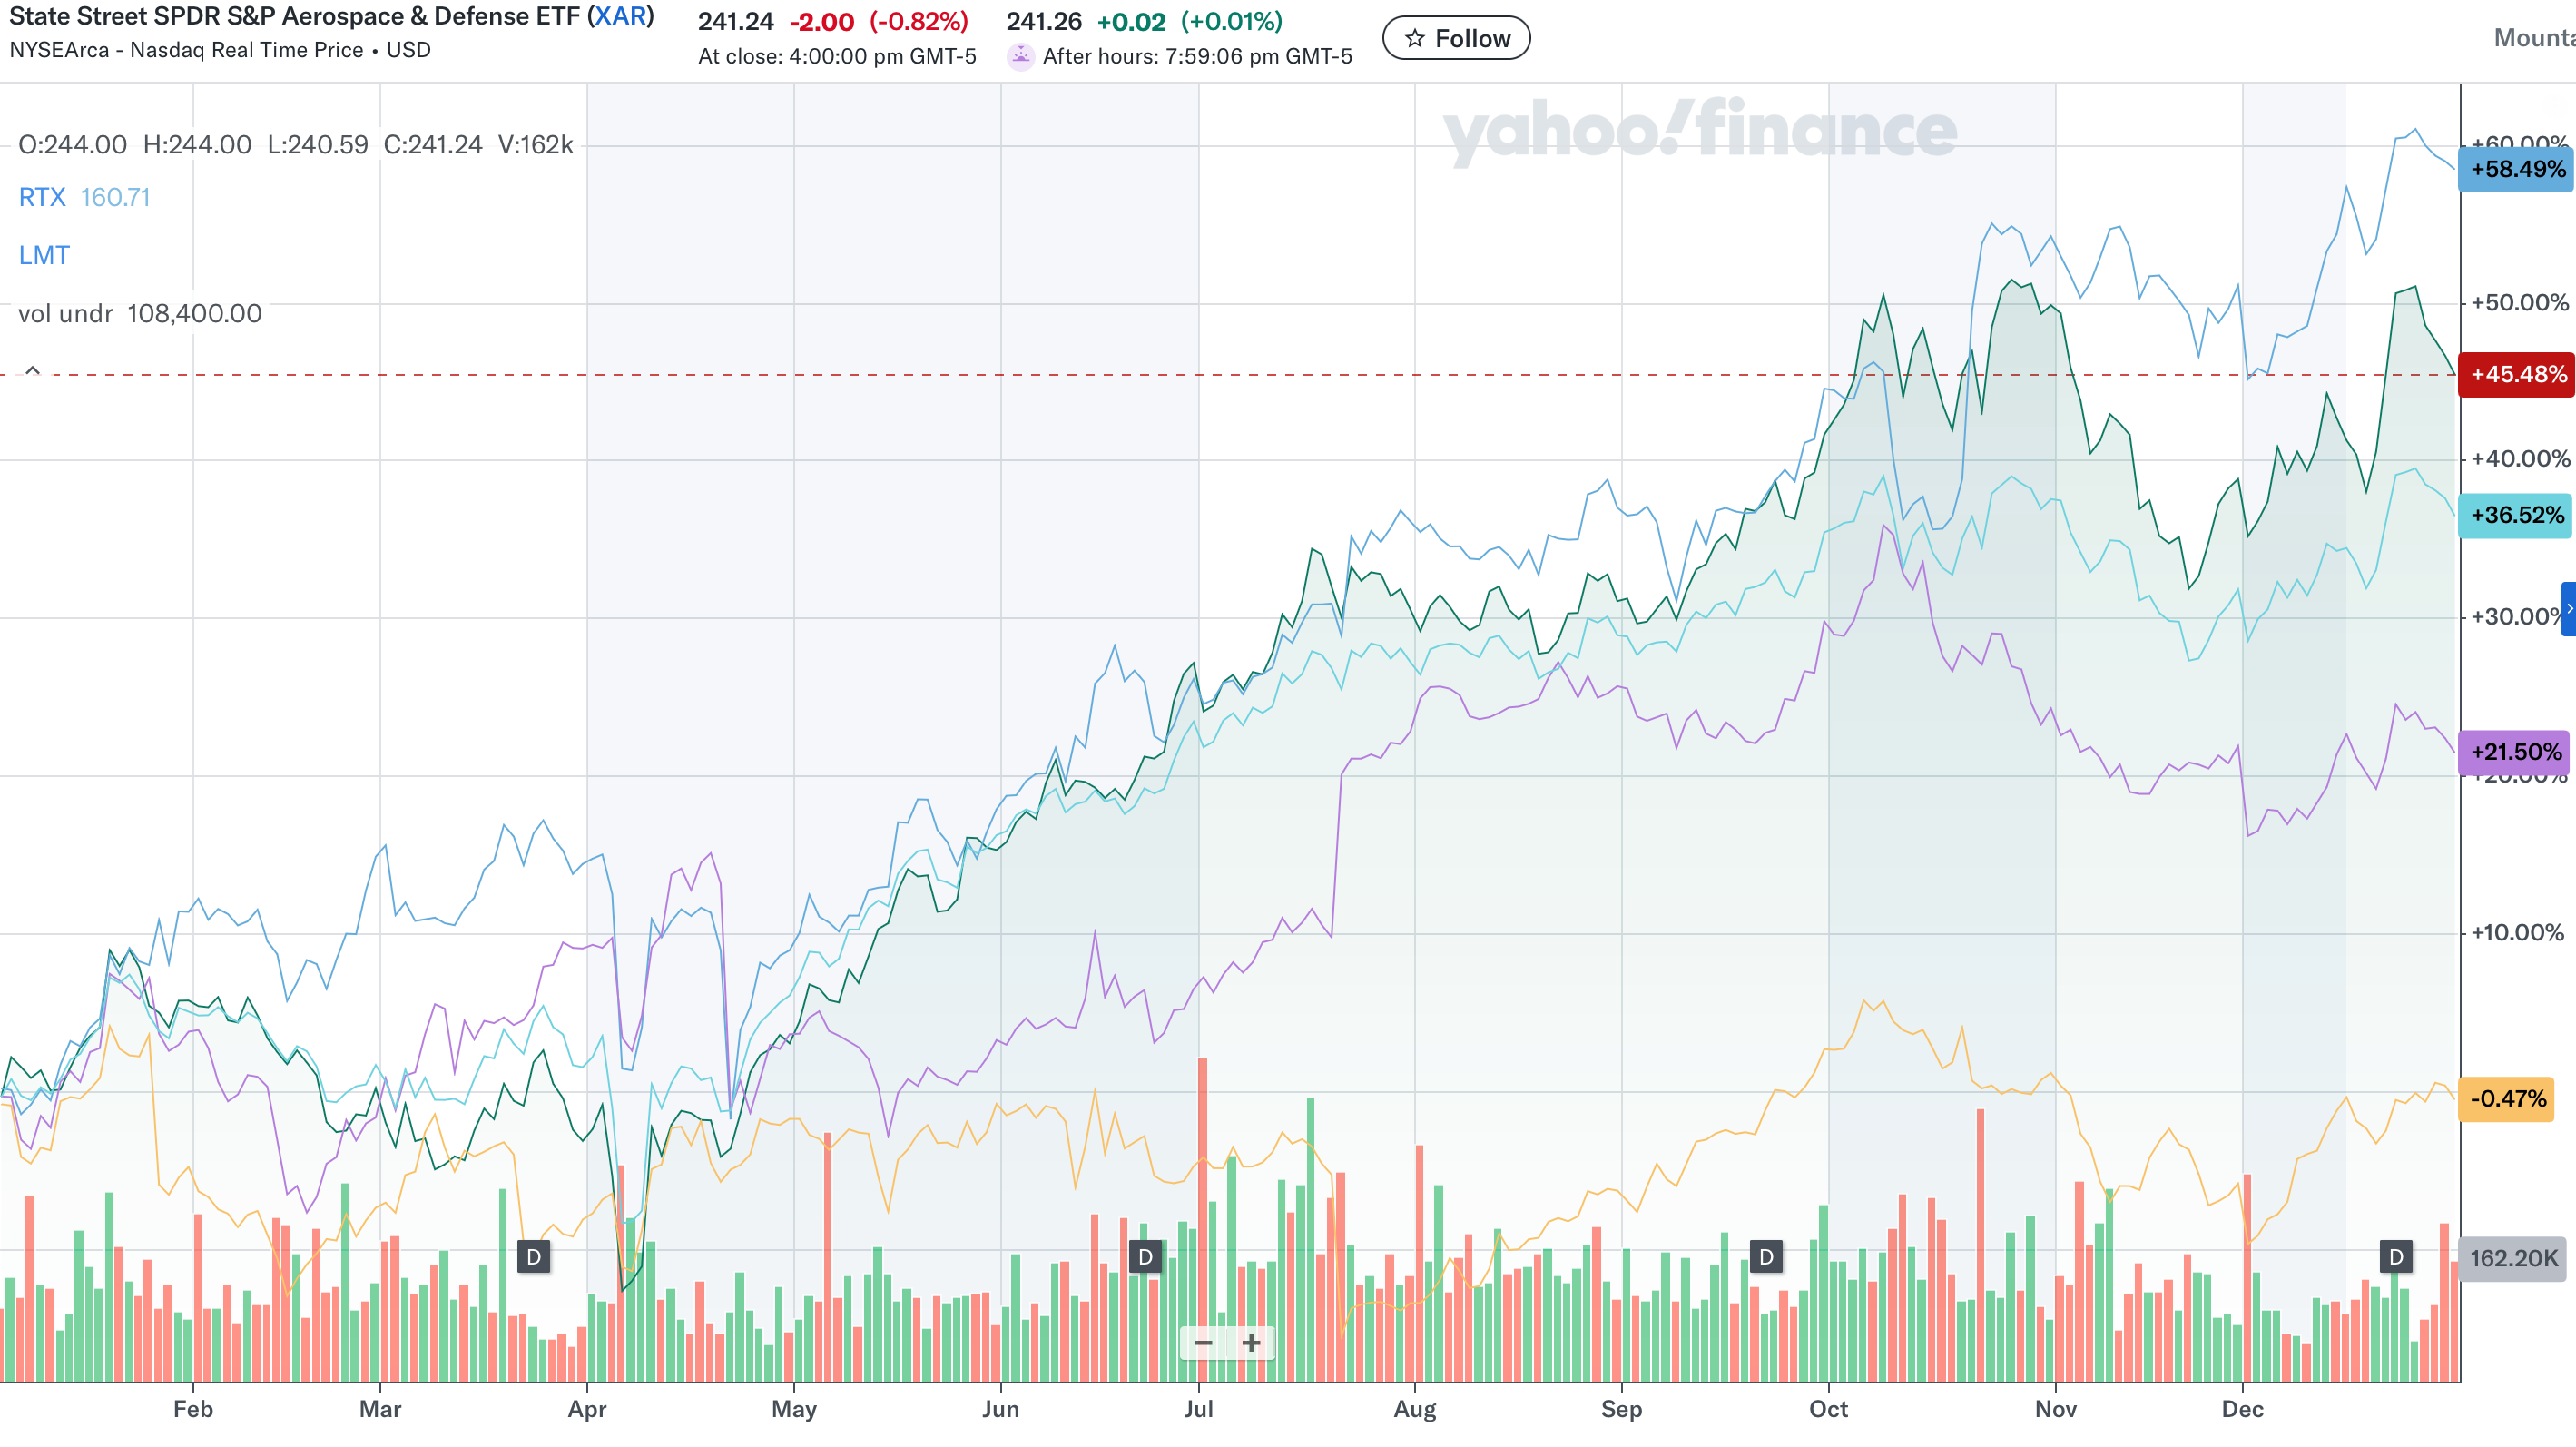
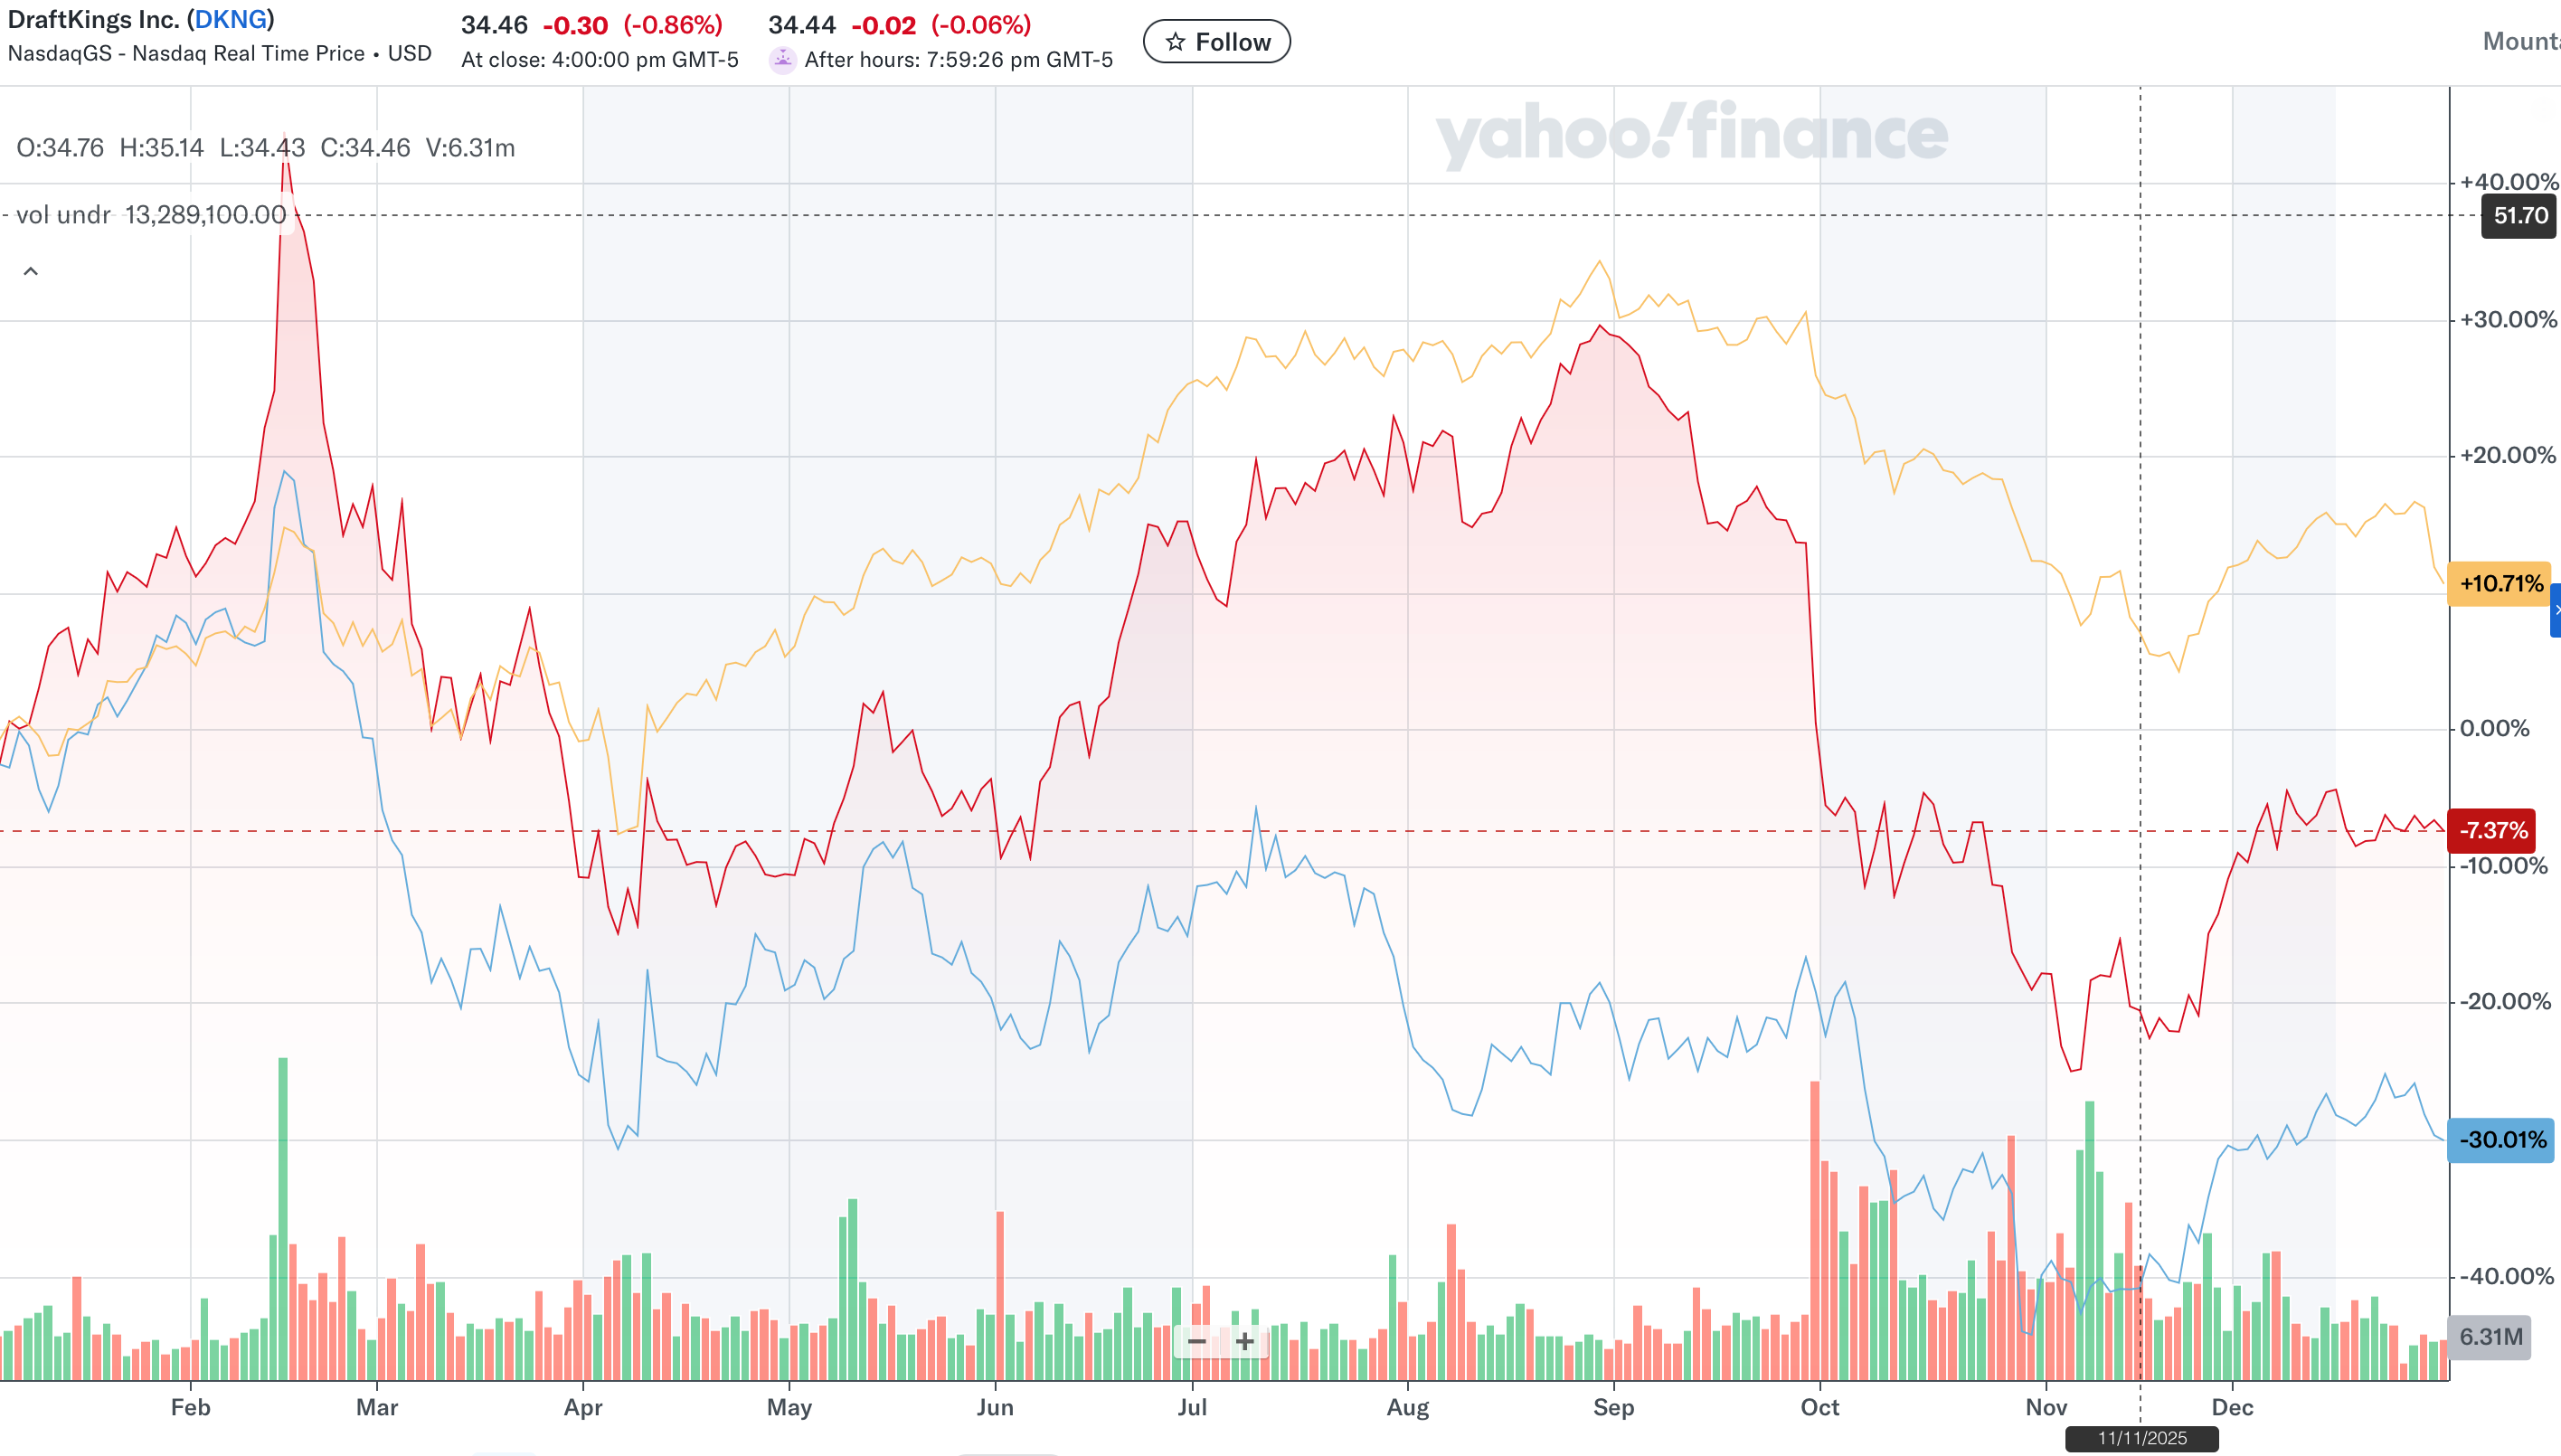
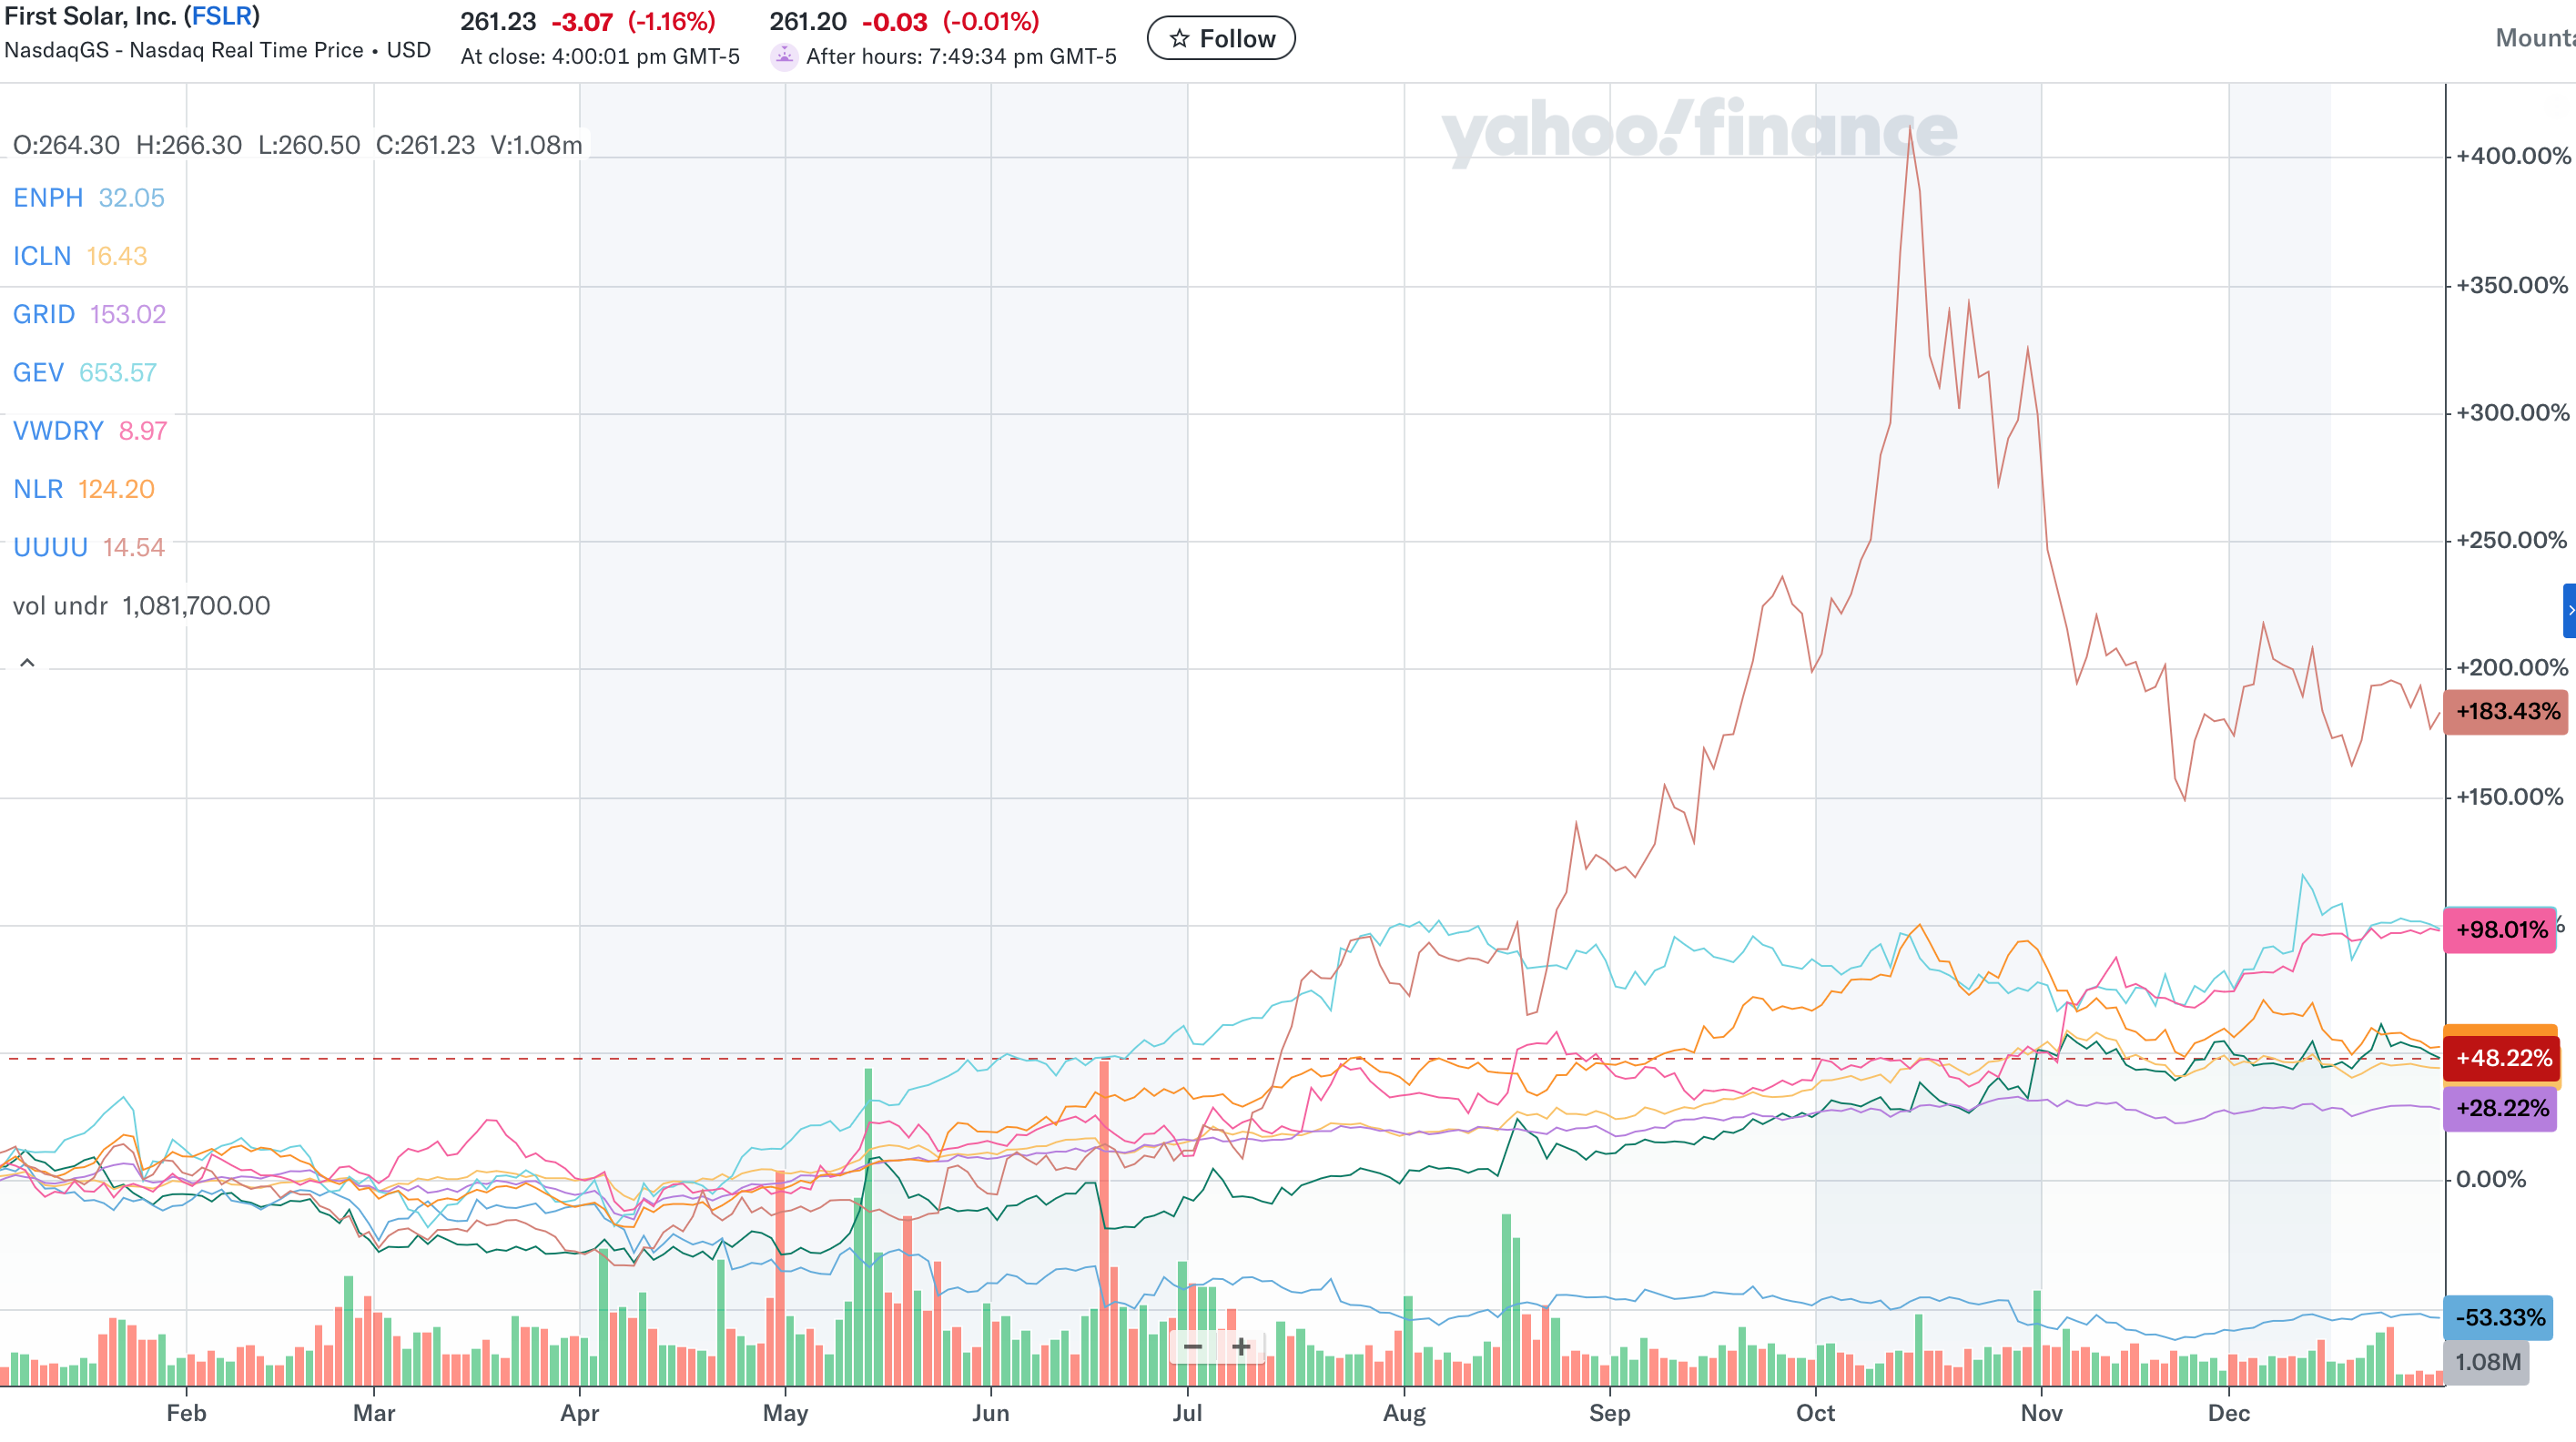
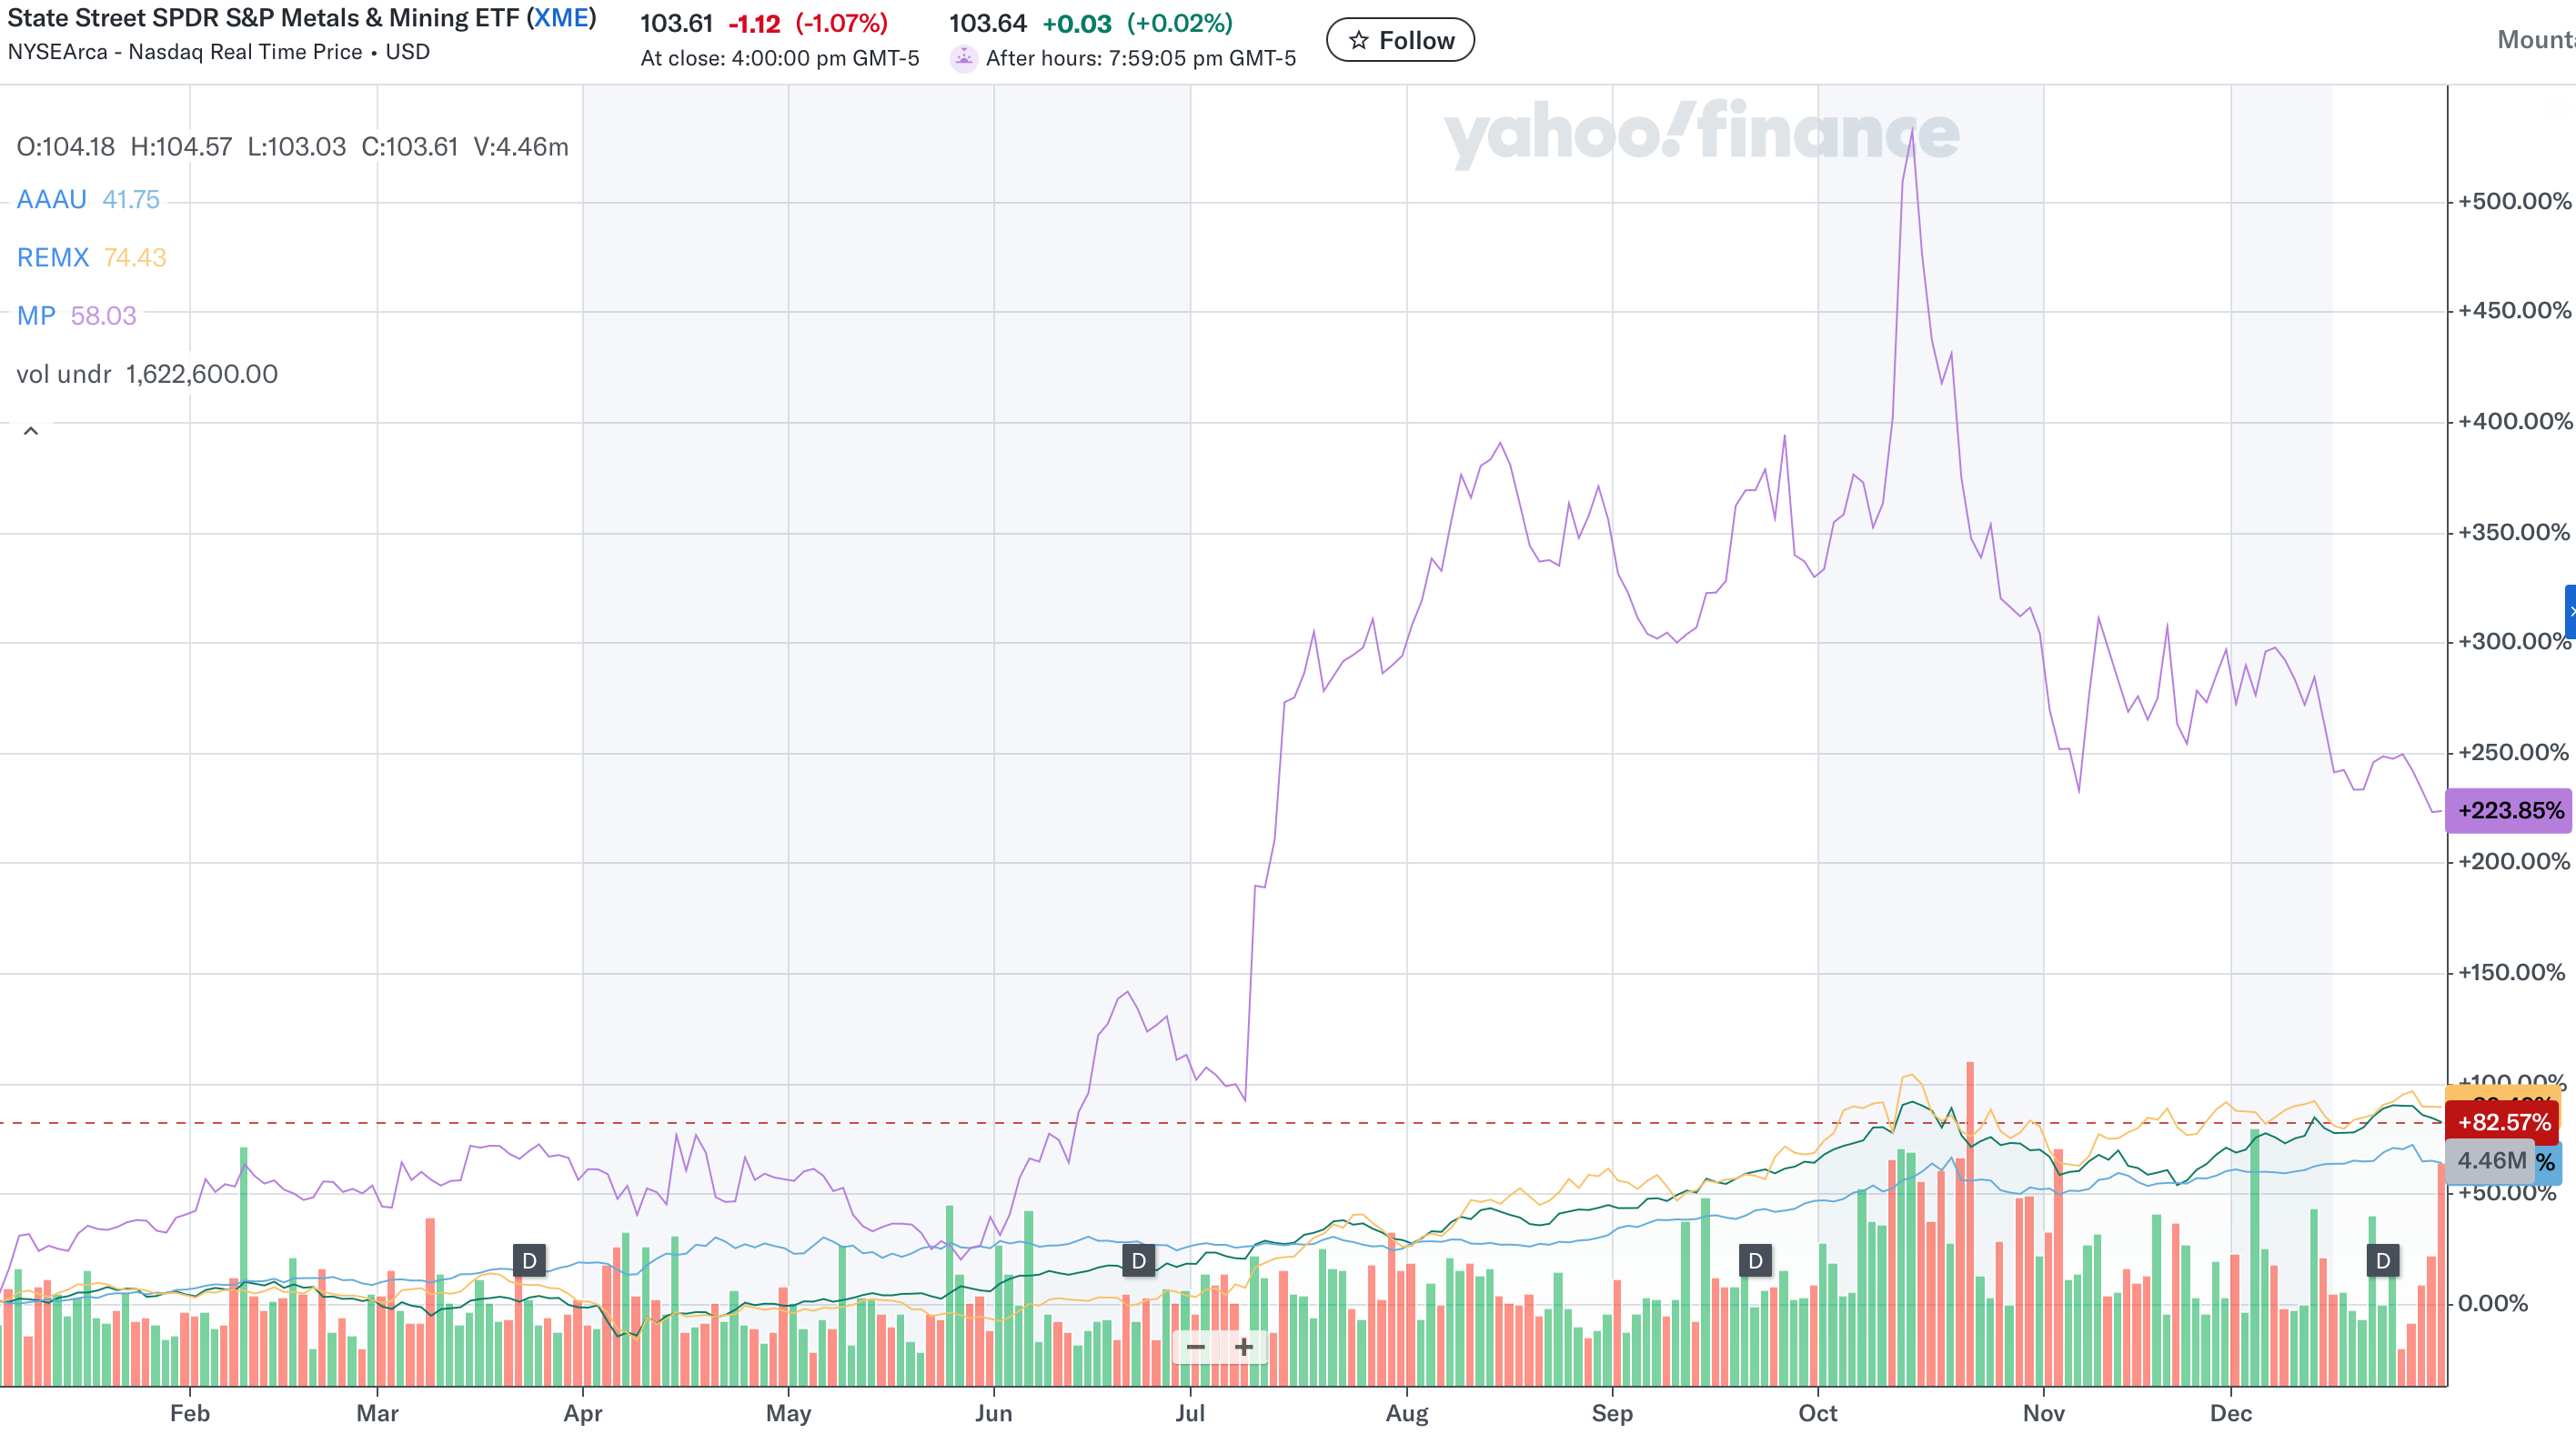
In this case risk on means growth stocks, what we are trying to do here is grow the value of the equities rather than rely on them for any kind of income. For this reason I do research on themes and then individual equities that represent the best opportunities in that theme, in 2025 the themes were:
For the 2026 thematics see this post.
Now once you have your baskets, the next step is to size the positions using Hierarchical Risk Parity which gives you the following correlation matrix:
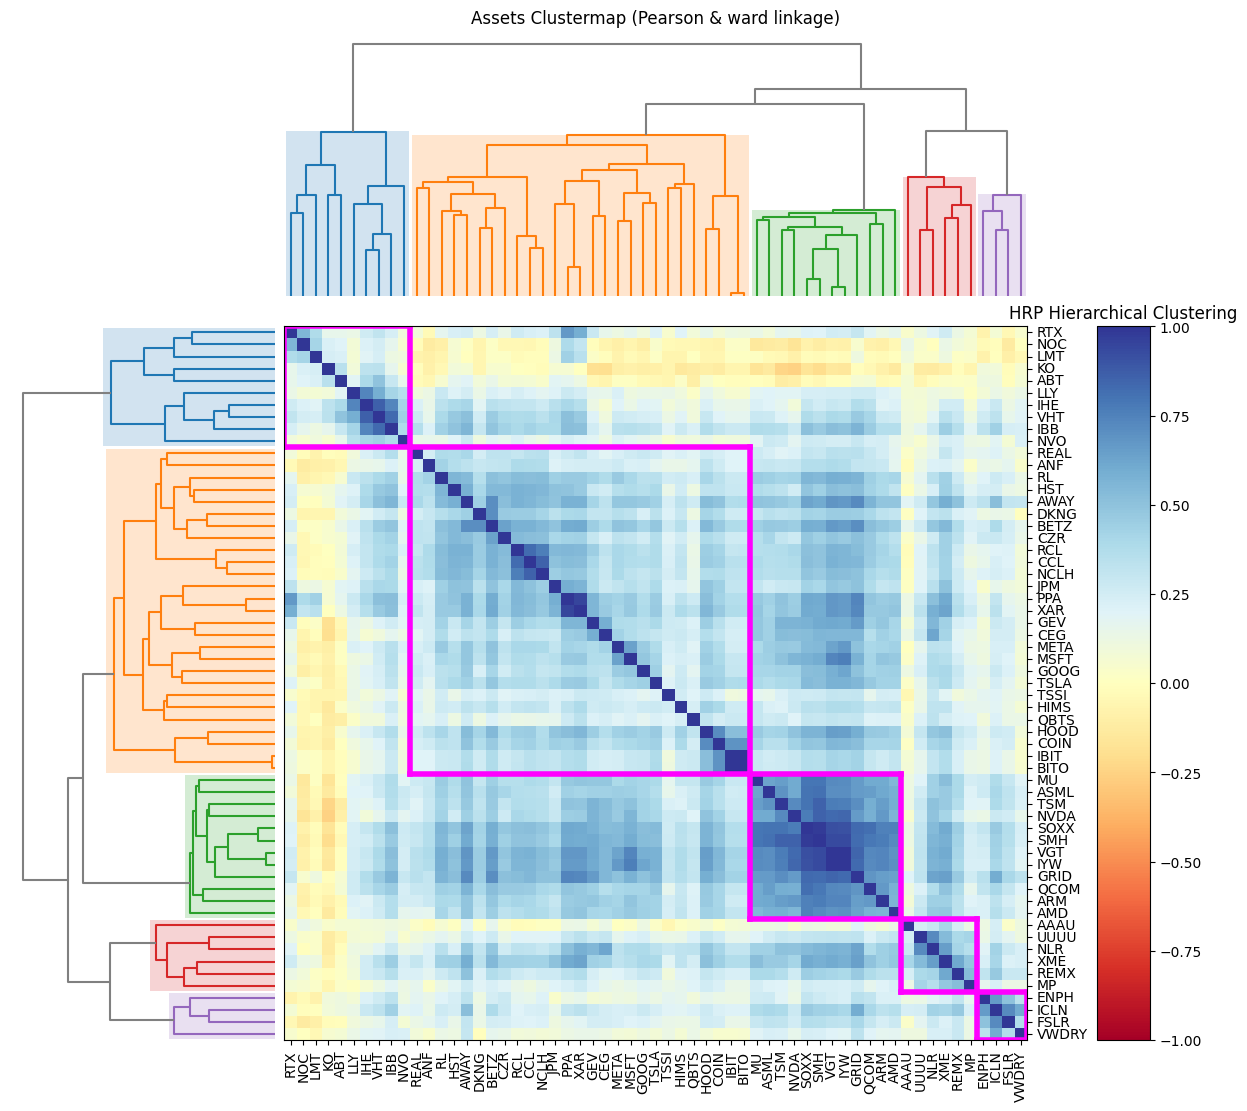
As we can see stocks like NOC and LMT are in the same cluster, as are ICLN and FSLR, showing that this system can see that these stocks move together, and thus don’t represent distinctly different risk profiles. In order to de-risk the portfolio, we have to give each cluster a size and allocate according a size for each asset in the cluster.

Now before we apply this weighting, we denoise the correlation matrix using the Marchenko-Pastur theorem.
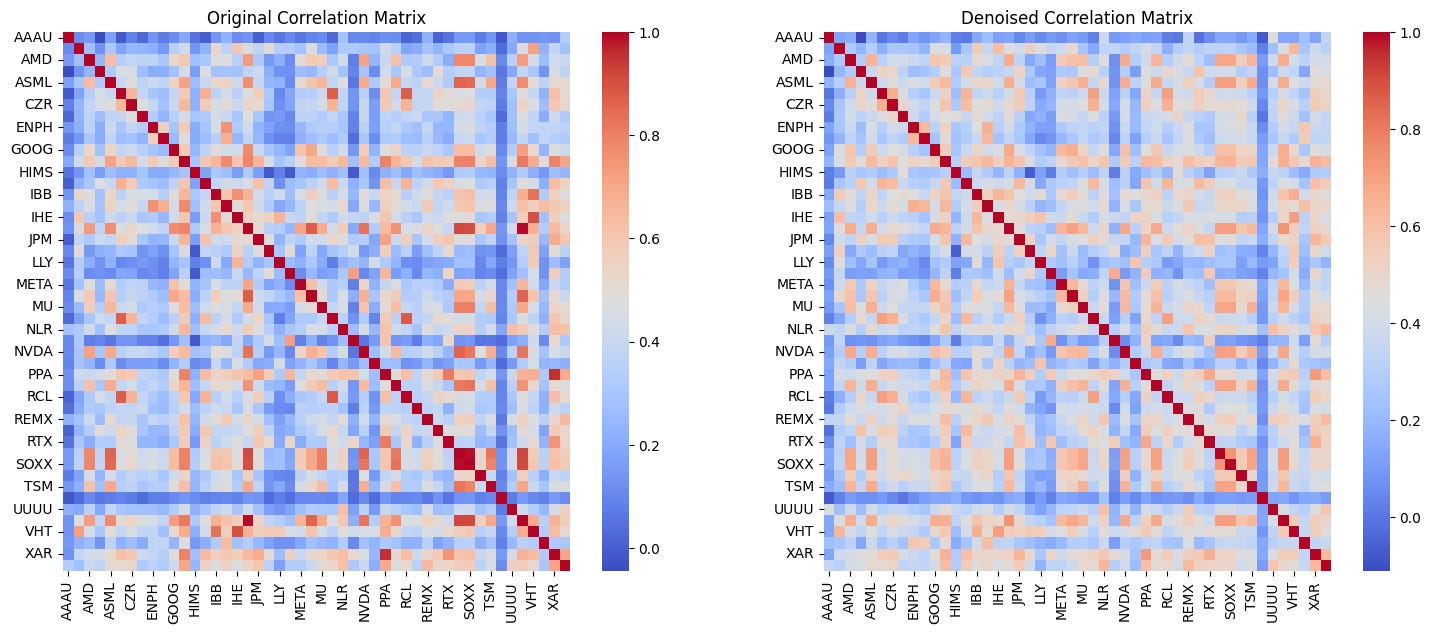
This results in a less noisy correlation matrix allowing our HRP allocations to become more optimal by focusing on the underlying signal within the covariance of the assets.
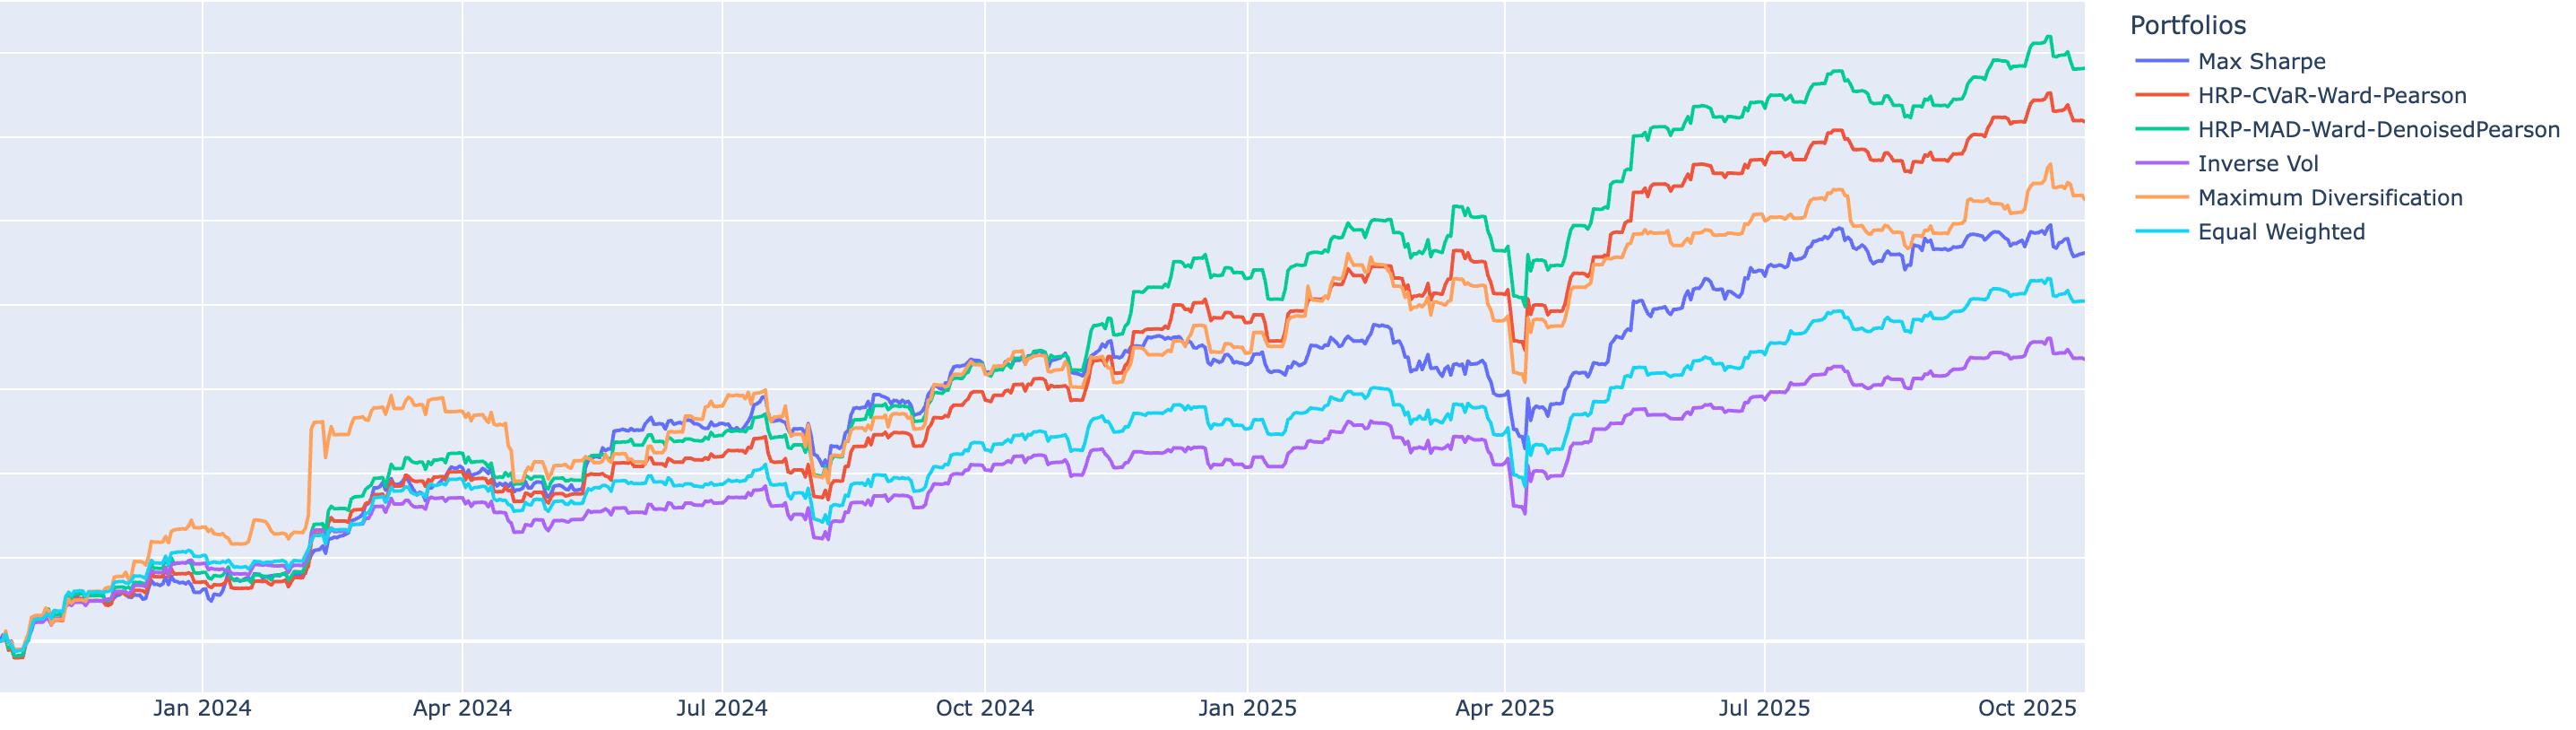
If we look at the performance of the various weighting strategies over the period of 2 years we can see the top 2 are our HRP weights with the top being the addition of the denoised correlation matrix.
Risk Off
In this case risk off means low volatility high dividend style stocks, the point of this portfolio is not to focus on growth but get a stable income out of the assets. This makes the weighting of this portfolio different to risk on, as we assume our picks here have largely removed the risk by focusing on low volatility, so all we are really looking to do here is maximise the dividends first and maximise growth second.
To this effect, instead of hedging risk by correlation based methods, we assume the risk has already been hedged due to the selection effects of the basket. In lieu of this I simply pursue a max sharpe optimisation strategy which optimises for the maximum Sharpe Ratio of the assets in order to promote leverage.
This has indeed been generating a fair return but most importantly a decent income.
Recommendations
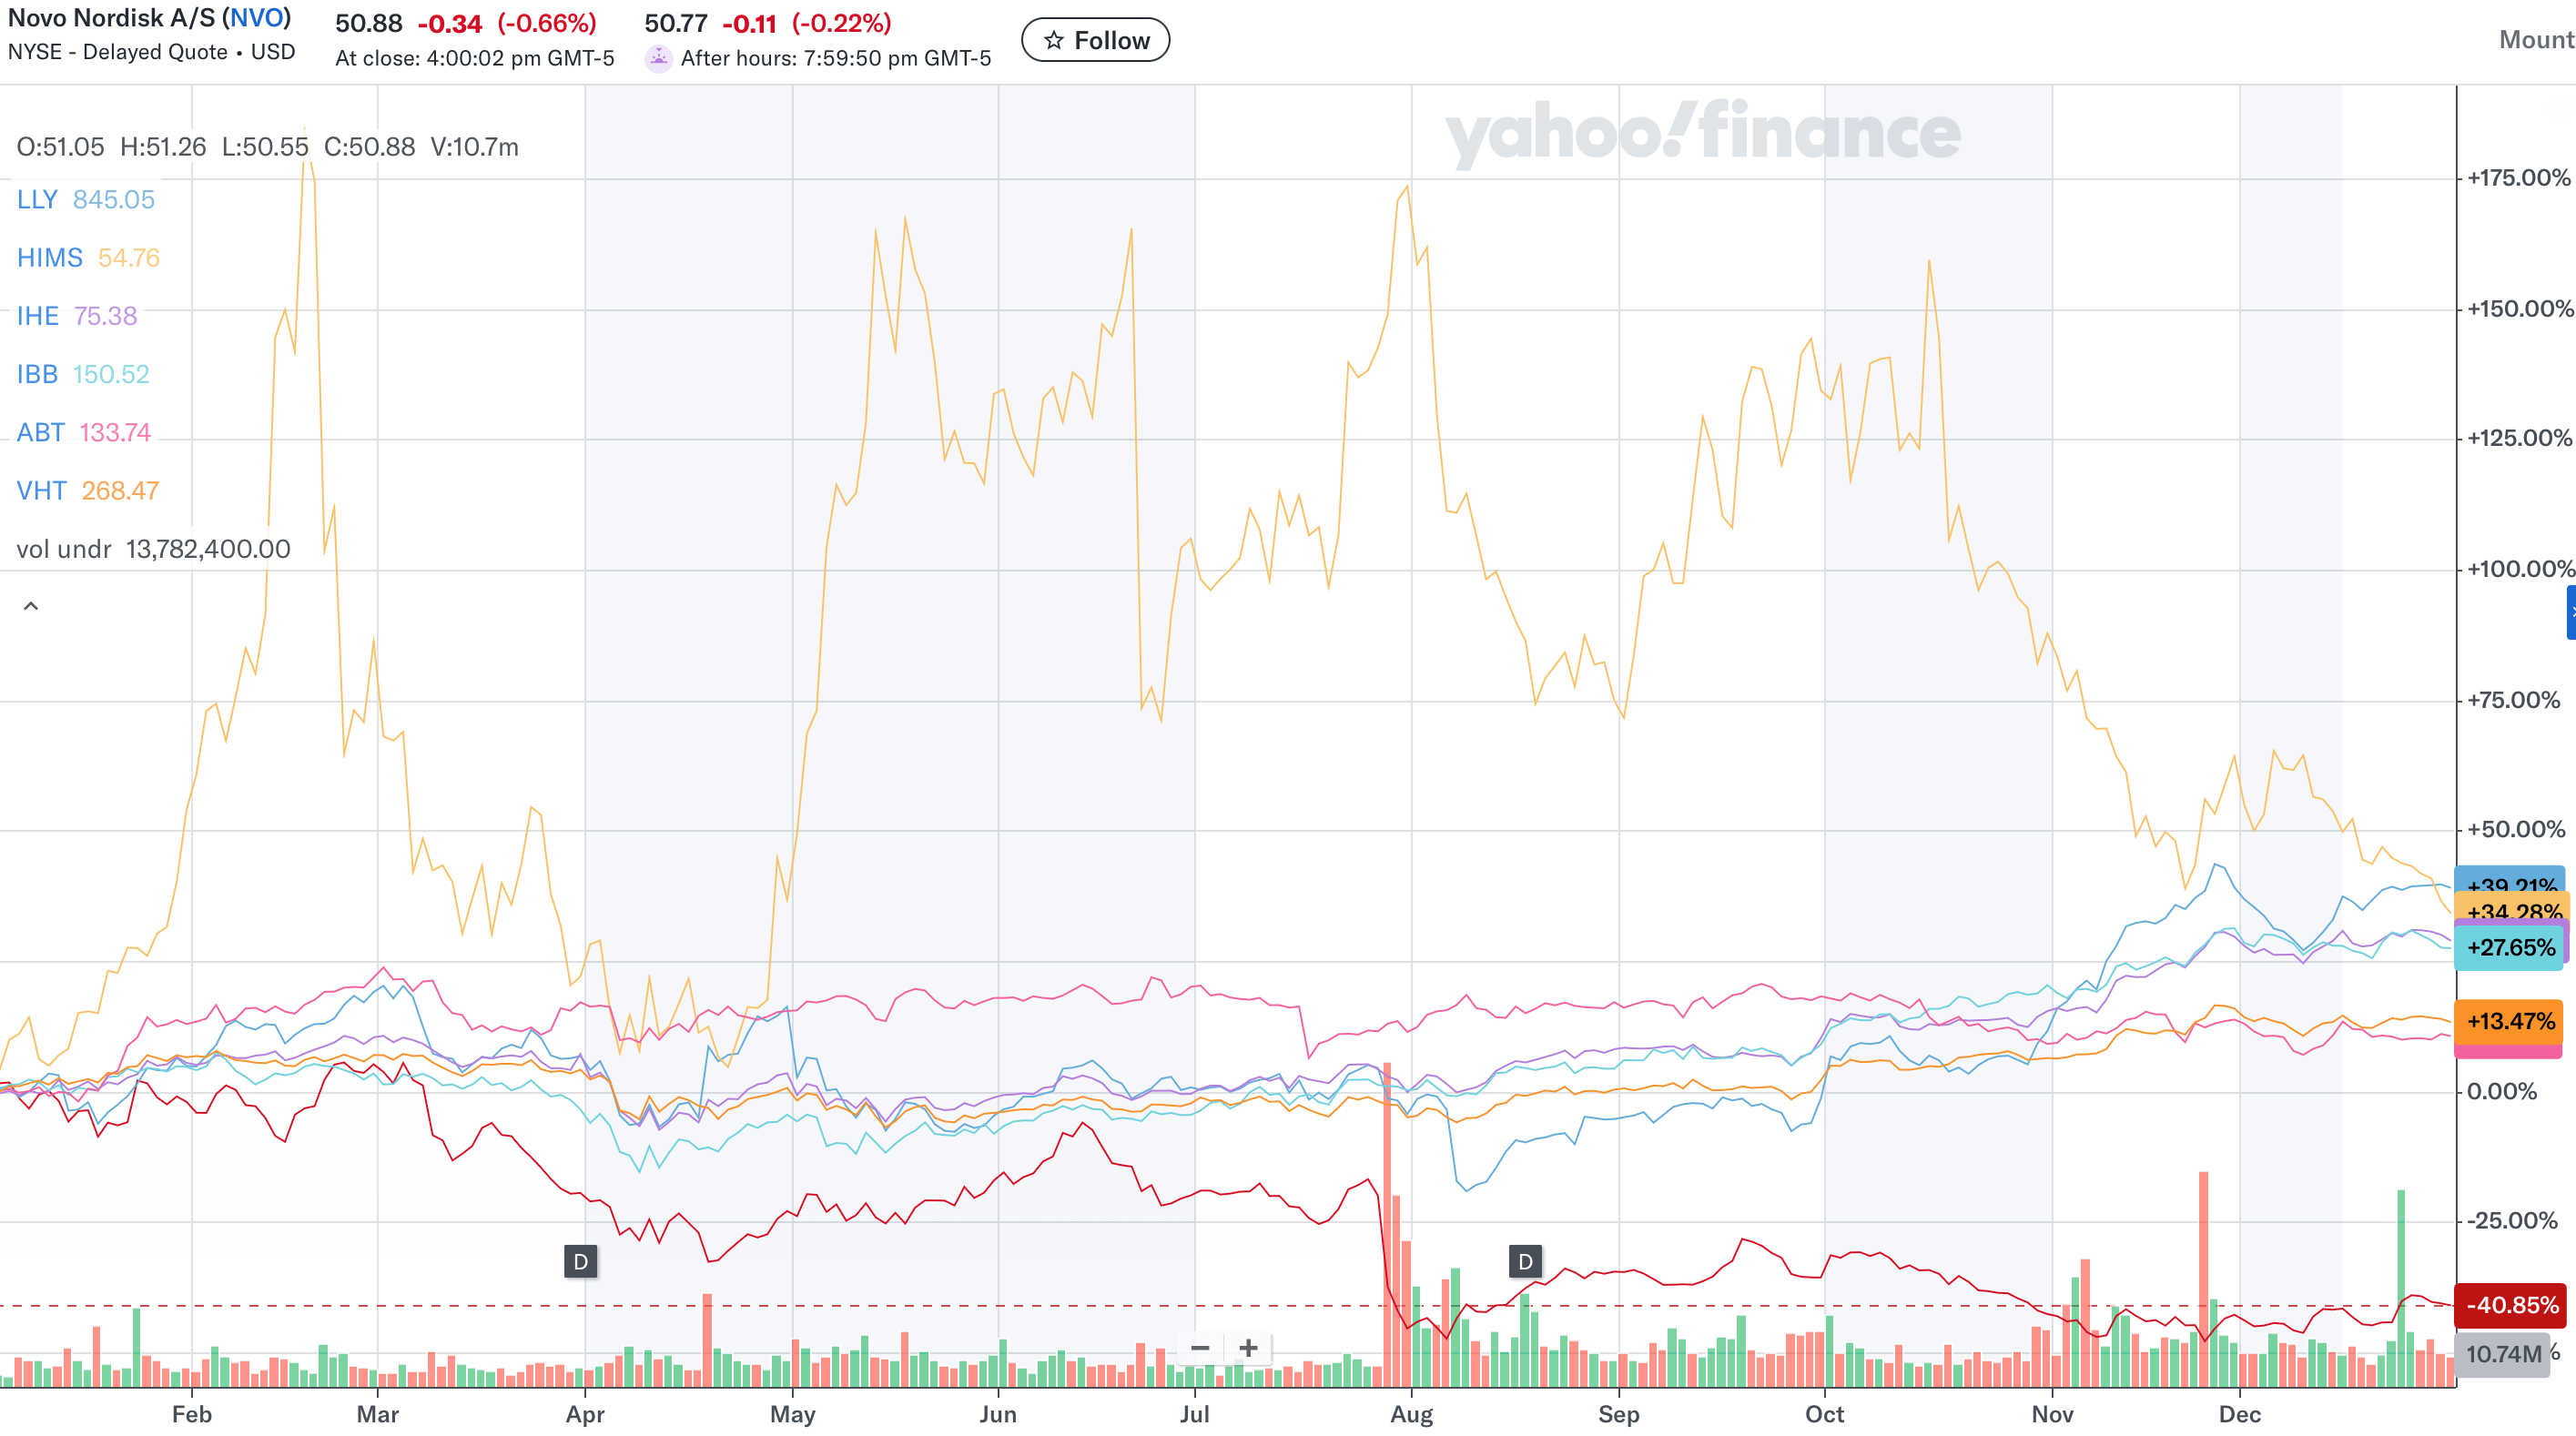
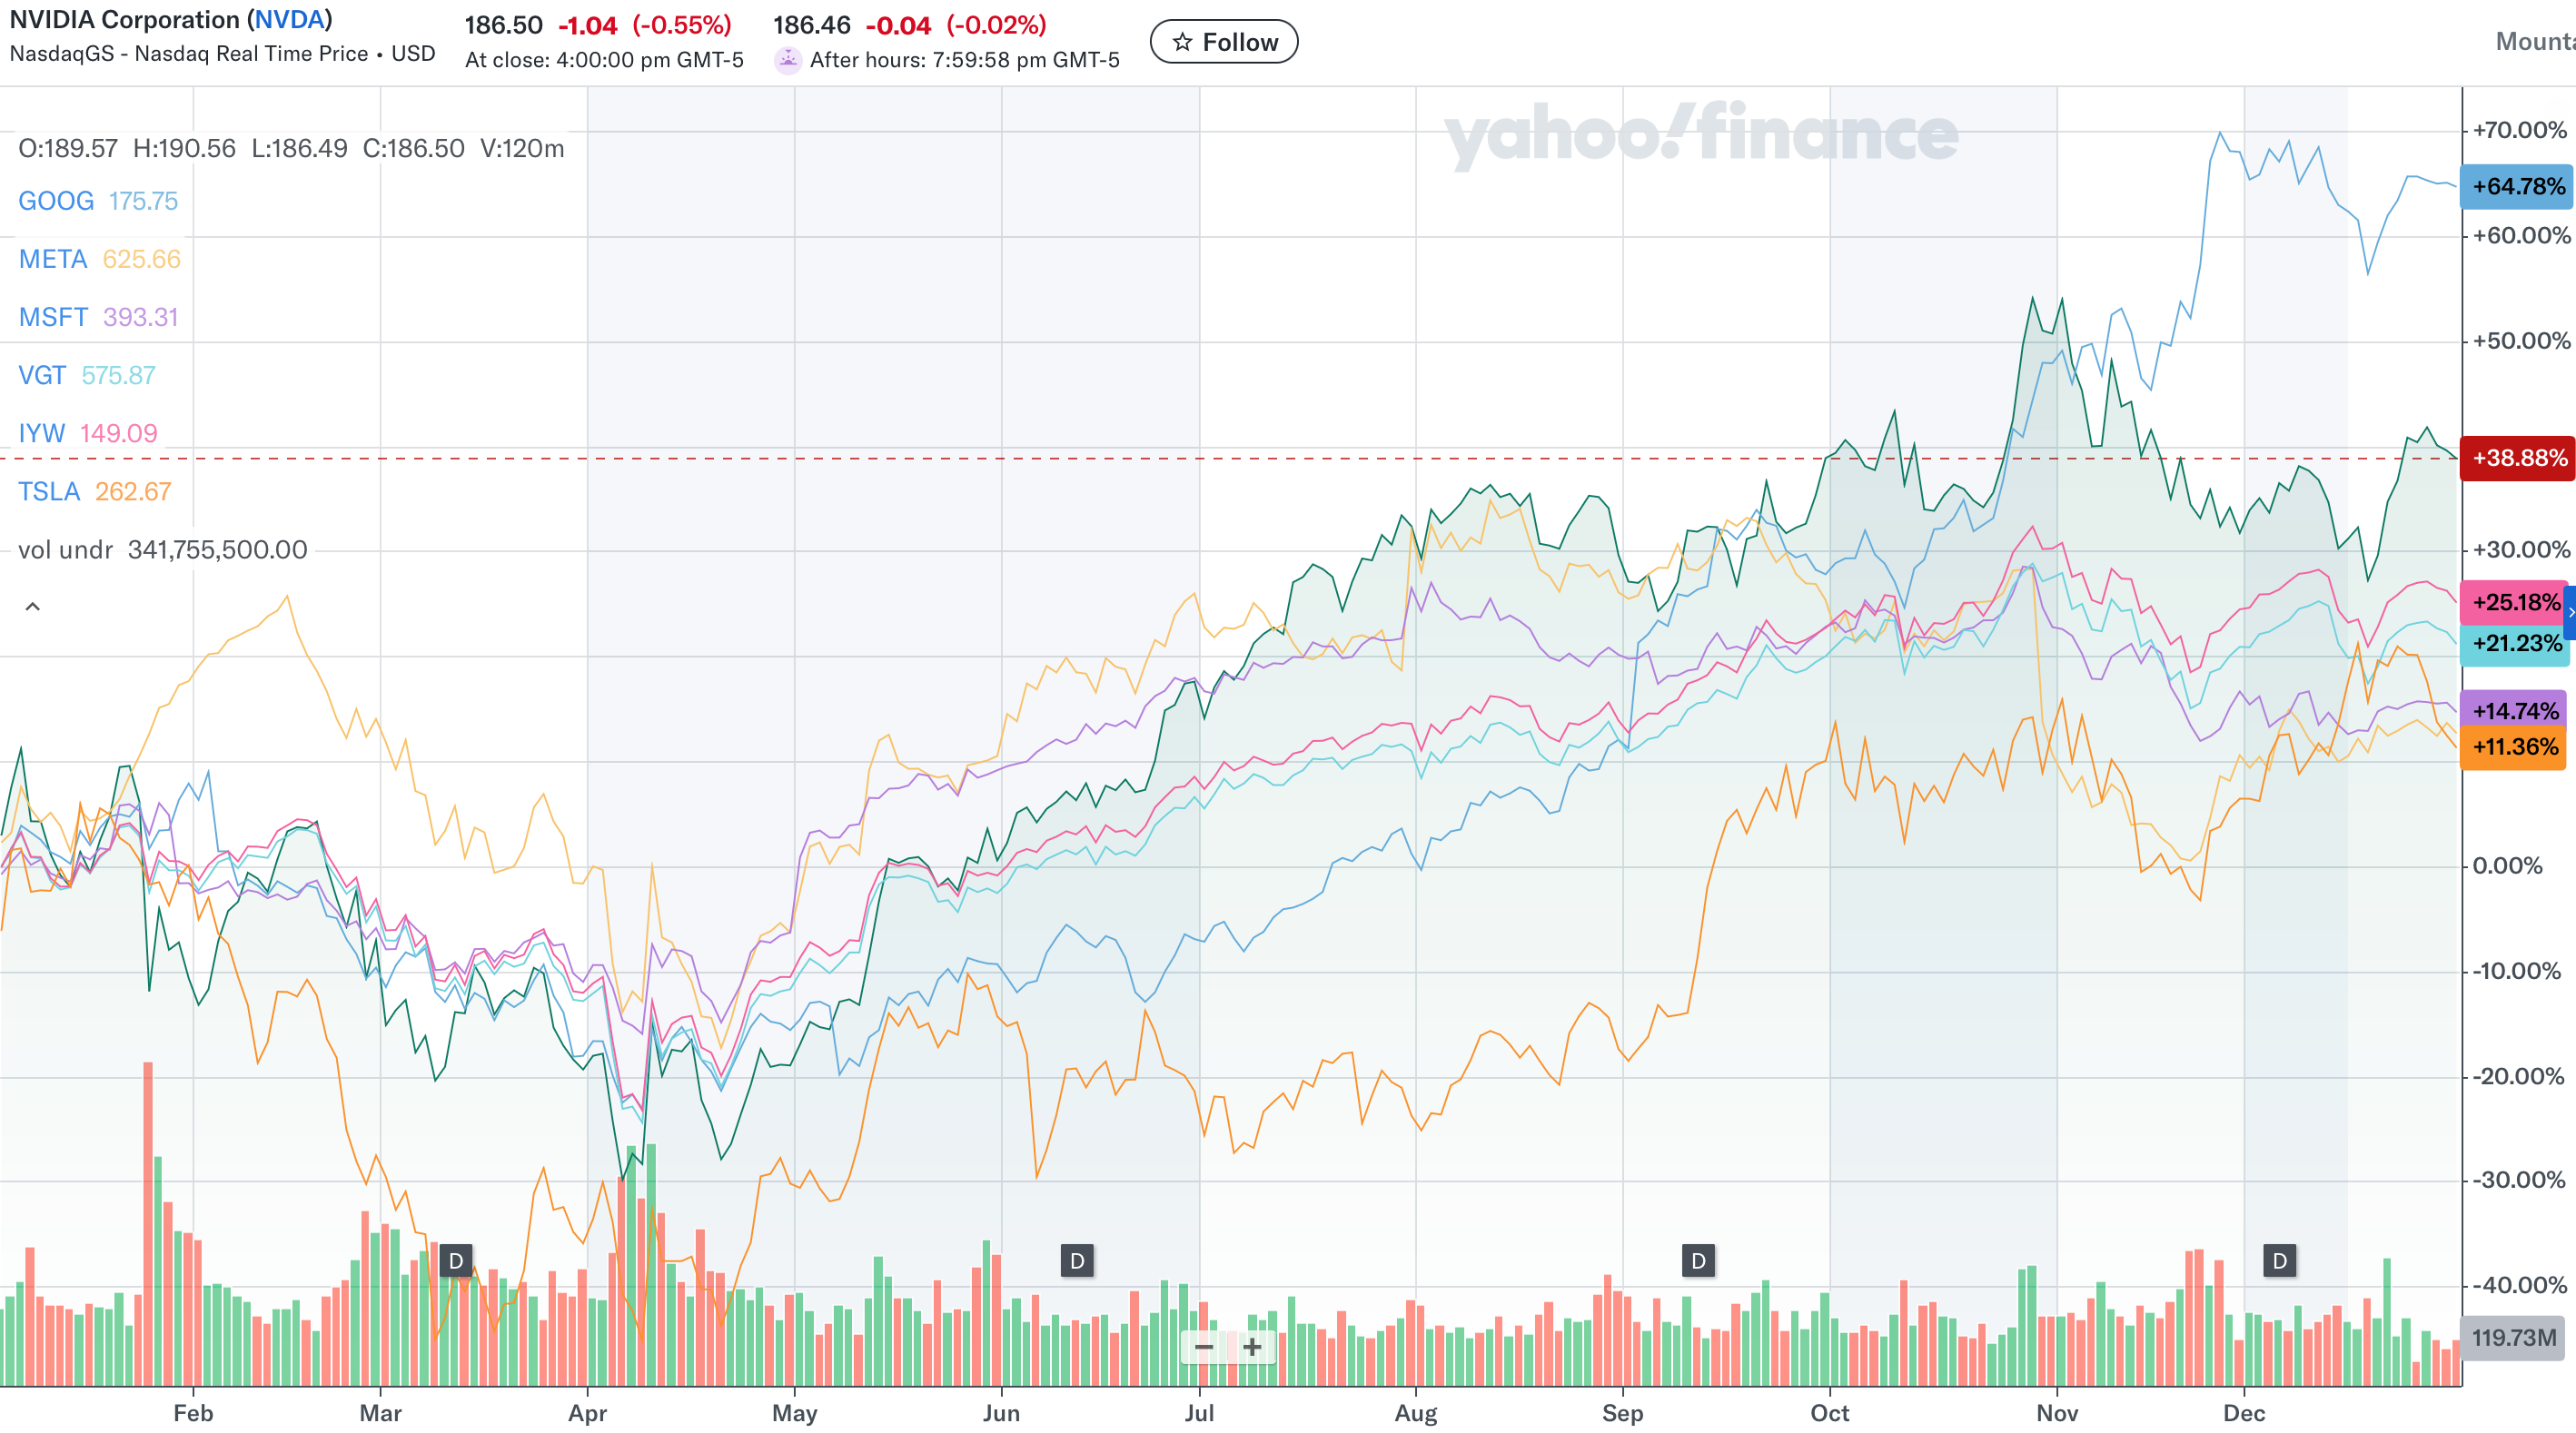
Every quarter I run recommendations, this takes the form of which equity to add and which to sell off, for risk on recommendations this simply looks at the sharpe ratio gain by adding or removing the stock, and for risk off recommendations it has to have a sharpe ratio gain as well as a dividend gain. If we look at the recommendations this year it has been a mixed bag:
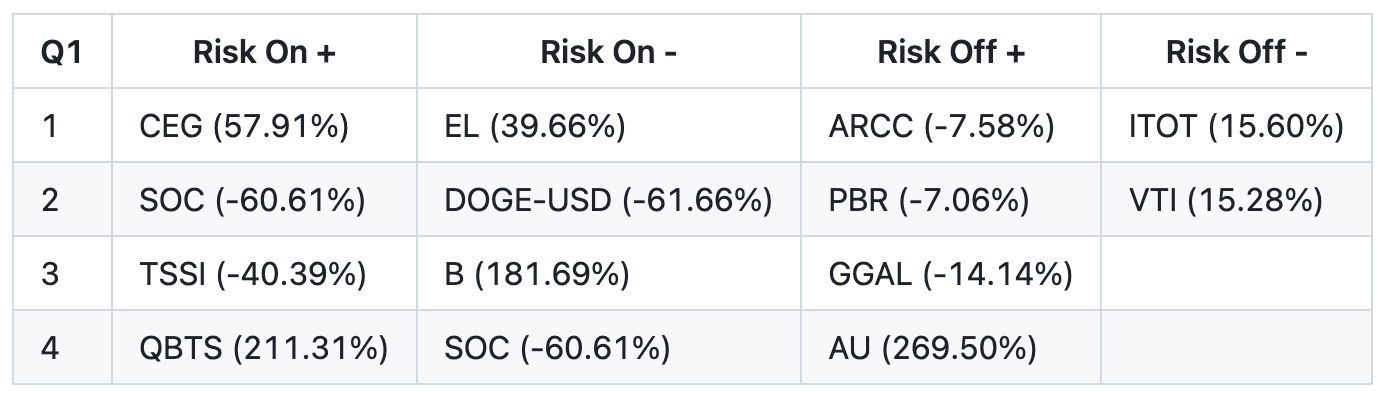
There were some good catches but some big misses too. It looks like our sharpe ratios are being impacted by fat tails (big spikes in price), since this only looks at the last year of price action I think it is prudent to filter out volatility here and only look for low volatility additions.
What’s next?
This year I will be looking into the following to extend the breadth and depth of the portfolio:
Moving to Interactive Brokers: Currently I use Etrade which is great but doesn’t afford me access to futures and forex and world stock markets. I have been eager to take positions on the UAE real estate market but can’t find the appropriate vehicle via the NYSE.
Simple Strategies: I have been working on a way to mine basic strategies for a while now using VectorBT, and using probabilistic Sharpe analysis find the strategies that have low volatility, high sharpe ratios and good capital efficiency.
Earnings Calls: I have been using Grok to perform analysis on social sentiment regarding earnings calls, combined with insider trading and options flow data I think this will be a powerful tool to determine the value of options before these events.
Options Panels: I have had a project going for a little while that predicts the probabilistic pathway for an equity price and determines the best options to buy for the assets in its panel everyday.
Bio-Pharma Catalysts: I have seen a large amount of wins this year stemming from well placed options on pharmaceutical studies, and will be developing a strategy to take advantage of these catalysts.

How are you doing your Kelly fraction calculation Will? Are you using the discrete form or the continuous form i.e. Sharpe ratio / volatility = f*?