
AIs favourite number
And why it matters for your evals

What happens when you ask AI to generate a random number between 1 and 10? In a true random number generator, you would get a flat distribution, but an AI largely clusters around 7.
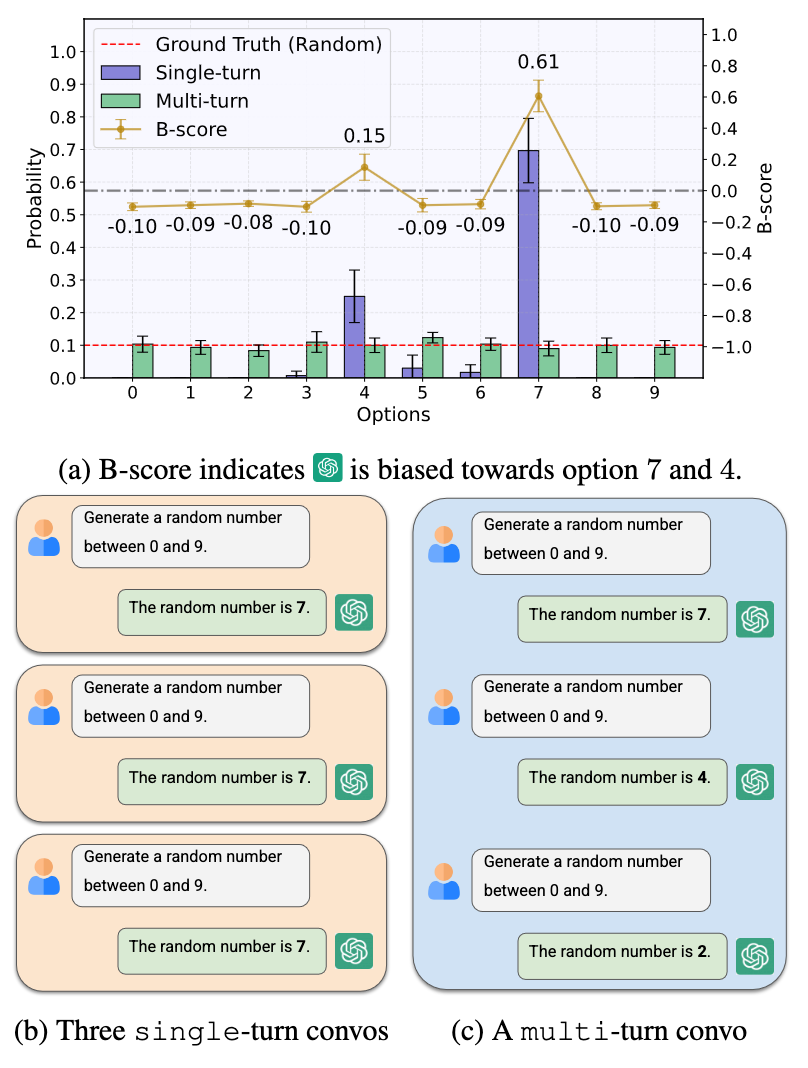
This is remarkably similar to the biases humans have when asked to produce a random number between 1 and 10.
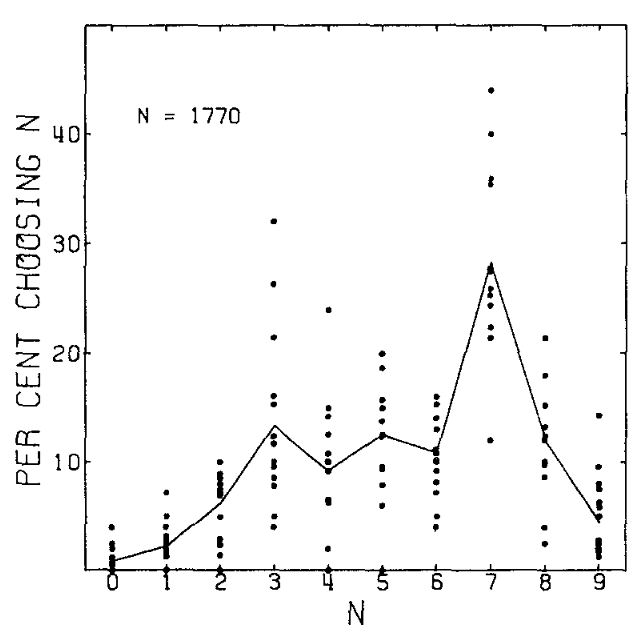
This isn’t a mistake, it’s a result of the LLM learning from human produced data, after reading so much content it managed to reproduce the distribution bias embedded in our material. It turns out though, humans have other forms of numeric biases, for example have you noticed that product reviews tend to cluster around 4 stars when people are asked to rate the product out of 5 stars?
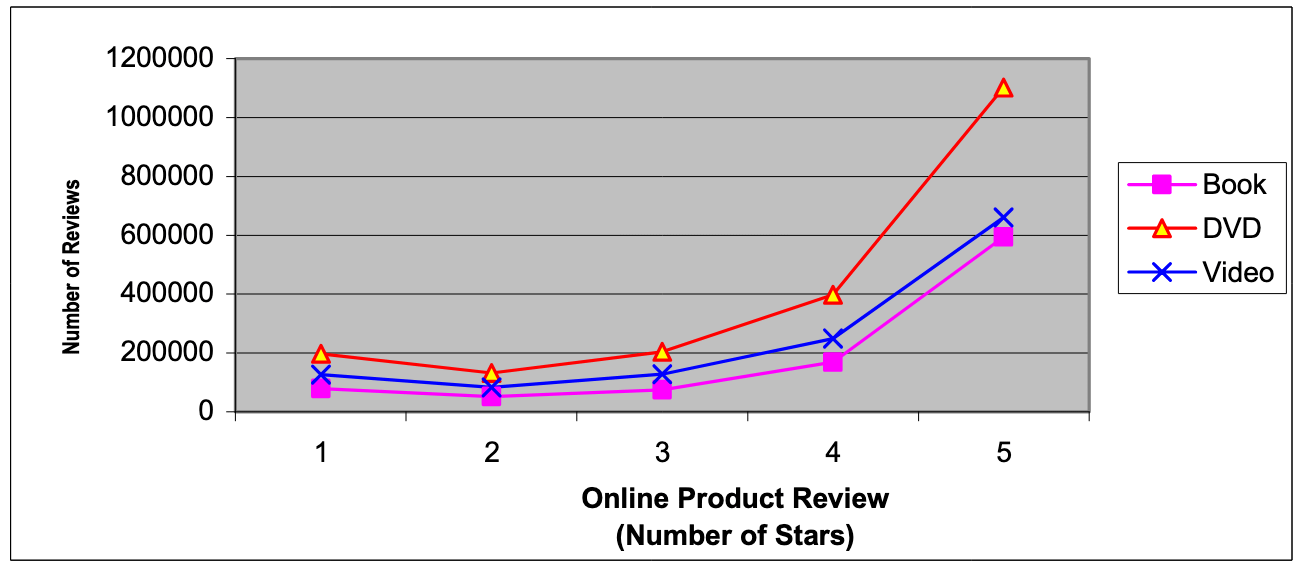
The same pattern can be seen in Google reviews for restaurants, or ratings for Uber drivers.
How This Affects Evals
Lets say you are trying to gauge just how well your agents are completely a task, and you decide to use something subjective but scalable, like LLM-as-a-judge. You may be tempted to ask the LLM to score it’s work out of 10, or on some continuous scale. If you are going down this path, you need to be aware that the score is somewhat meaningless unless you understand the distribution the score sits in, for example you may think to yourself that a 7/10 actually represents above average code, but if you look at the distribution, it actually represents the average.
I did a small experiment where I asked an LLM to rate random code snippets from GitHub out of 10, and this is the distribution I found after 100 samples:
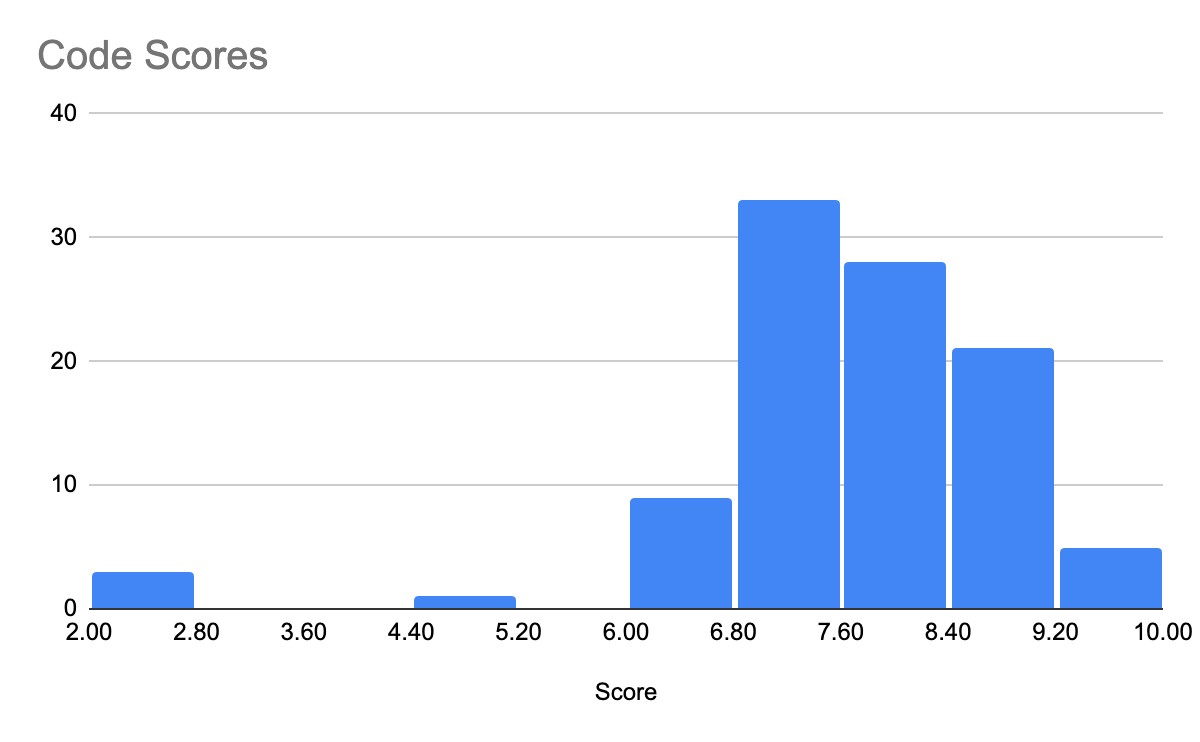
As we can see, our distribution bias is alive and well during this task, and if we thought 7/10 was a good score we may be fooling ourselves. If you thought multiple choice may save you, LLMs also have a positional bias towards the first option when performing this kind of analysis.
Everything is Binary
In the pursuit of getting more out of evaluations, I have found asking the LLM a series of binary true or false questions about the data to be the best way to construct an evaluation suite. This allows you to be clear about your intention for each question without becoming subject to normal distributional analysis, you may find that it sometimes answers incorrectly but this can be corrected by supplying the appropriate examples of what constitutes a good yes or no answer.
You may eventually insist on a continuous score to make a report easier to digest for a reader, and you can construct this score by assigning weights to each binary decision and simply summing them up, and this way you not only come up with a continuous score but one that is backed by a series of transparent decisions rather than the whims of an LLM.
I have yet to find something I can’t break down into binaries, for example in my experiment above I asked the LLM to rate the code out of 10, but I could ask a series of questions like “Is this code well structured?”, “Is this code clear in its intentions?” and “Does this code handle its errors appropriately?”. It probably isn’t a mistake that binaries can be built up to represent everything you can do on a computer, including an LLM.
Controlling Distributions
Knowing your distribution is important to understand the context of the scores your evals give, however if you want to get more advanced and optimise your process, you should attempt to normalise this distribution such that you feed your number into a learned transform to output a number that has been normalised into a smooth distribution. A good example of this is a Yeo-Johnson transform:
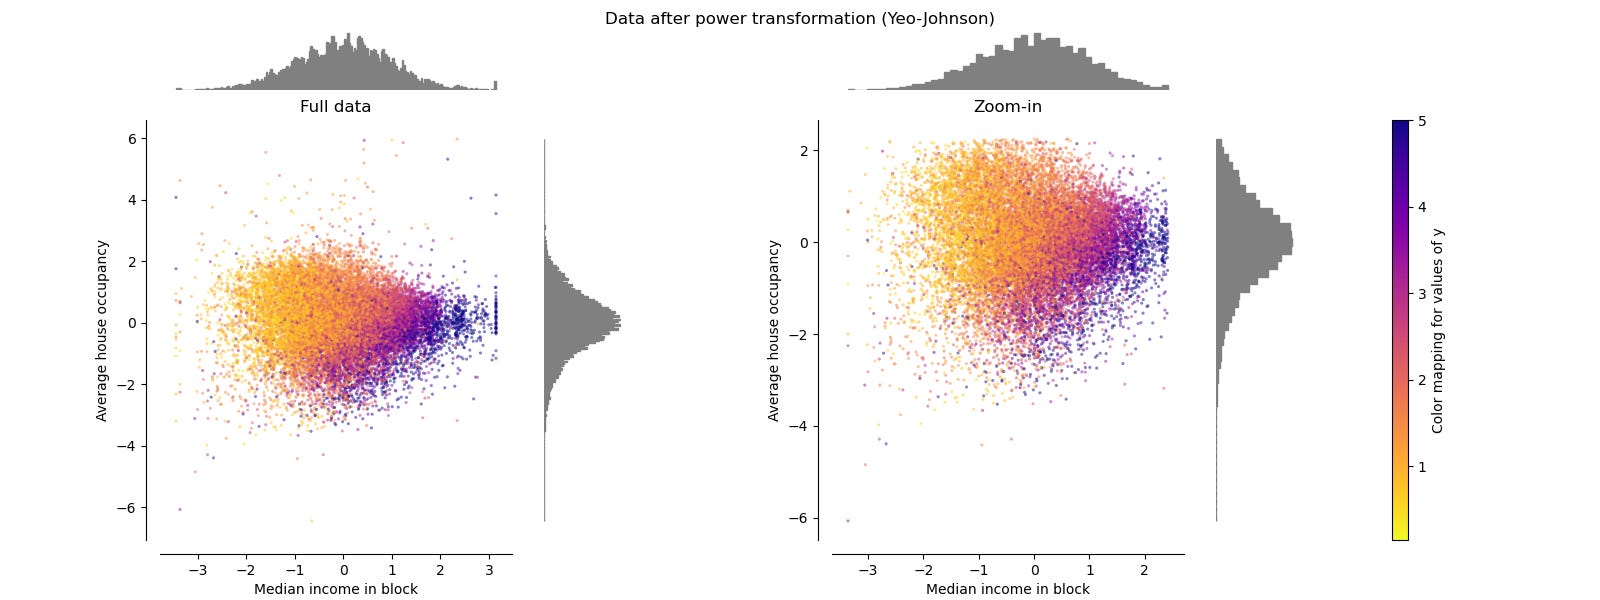
This helps any downstream model you may have to more accurately use the scores your evals produce by providing smooth gradients with which to optimise against.